Employees



Boost Your Wealth and Shield Your Future with HDFC Life Sampoorn Nivesh Plus.
Dive into Our ULIP Selection

Schedule a call Click here

Give missed call to buy +91-9980970424
Contact Us

Login
 Customers

 Partner
In Unit Linked policies, the investment risk in investment portfolio is borne by the policyholder. The linked insurance products do not offer any liquidity during the first five years of the contract. The policyholder will not be able to surrender or withdraw the monies invested in linked insurance products completely or partially till the end of the fifth year.Show Less ...Read More
A Unit Linked Insurance Plan (ULIP) is an innovative financial product that gives you two benefits in one: life insurance protection and market-linked investment growth. With ULIP, you can select where your money goes: equity funds, debt funds or hybrid options, depending on your comfort with risk.
Such ULIP plans assist you in building wealth steadily and supporting long-term goals like your child’s higher education or your own retirement. Many people prefer them when looking for the best ULIP plans or a flexible ULIP policy. Show Less ...Read More
Boost Your Wealth and Shield Your Future with HDFC Life Sampoorn Nivesh Plus.
Dive into Our ULIP Selection

Life coverage is available

Past 5 year returns of 19.24%**

Save tax2 up to Rs.46,800/-18

Multiple fund options
Get a Call Back
This service is available between 9 AM - 10 PM IST
Interested in buying insurance plans, then fill the form below to help us call you back. This form is only for exploring insurance plans provided by HDFC Life, for Customer Service queries, please click - Customer Service Queries
Thanks for contacting us.
We will get in touch soon.
Your call is scheduled for , between . You will receive a call from 8291890XXXX. Kindly attend the call. We respect your privacy. We do not spam.
Your call is rescheduled for , between . You will receive a call from 8291890XXXX. Kindly attend the call. We respect your privacy. We do not spam.
Your call is already scheduled for , between . Incase you want to reschedule the call; you can do it using the form above.
We're sorry, but you have reached the maximum number of rescheduling attempts allowed.





Francis Rodrigues has a decade long experience in the insurance sector, and as SVP, E-Commerce and Digital Marketing, HDFC Life, manages the online sales channel, as well as digital and performance marketing. He has had hands-on experience in setting up sales channels and functional teams from scratch over a career spanning 2 decades.
ULIP is a financial product that blends life insurance protection perfectly with market-associated investment growth. When you pay your premium, one part goes toward providing a life cover for your family, while the other is invested in funds of your choice.
You can zero in on equity, debt or hybrid funds, depending on your risk comfort level. This flexibility permits you to adjust your investment mix as your goals evolve/change. A ULIP helps you grow wealth steadily over time while ensuring that your loved ones stay financially protected throughout the policy term.
...Read More

A ULIP plan works by dividing your premium into two clear parts. One part secures a life cover, which ensures your family members remain protected. The rest of the amount is invested in market-associated funds, i.e., equity, debt or hybrid options.
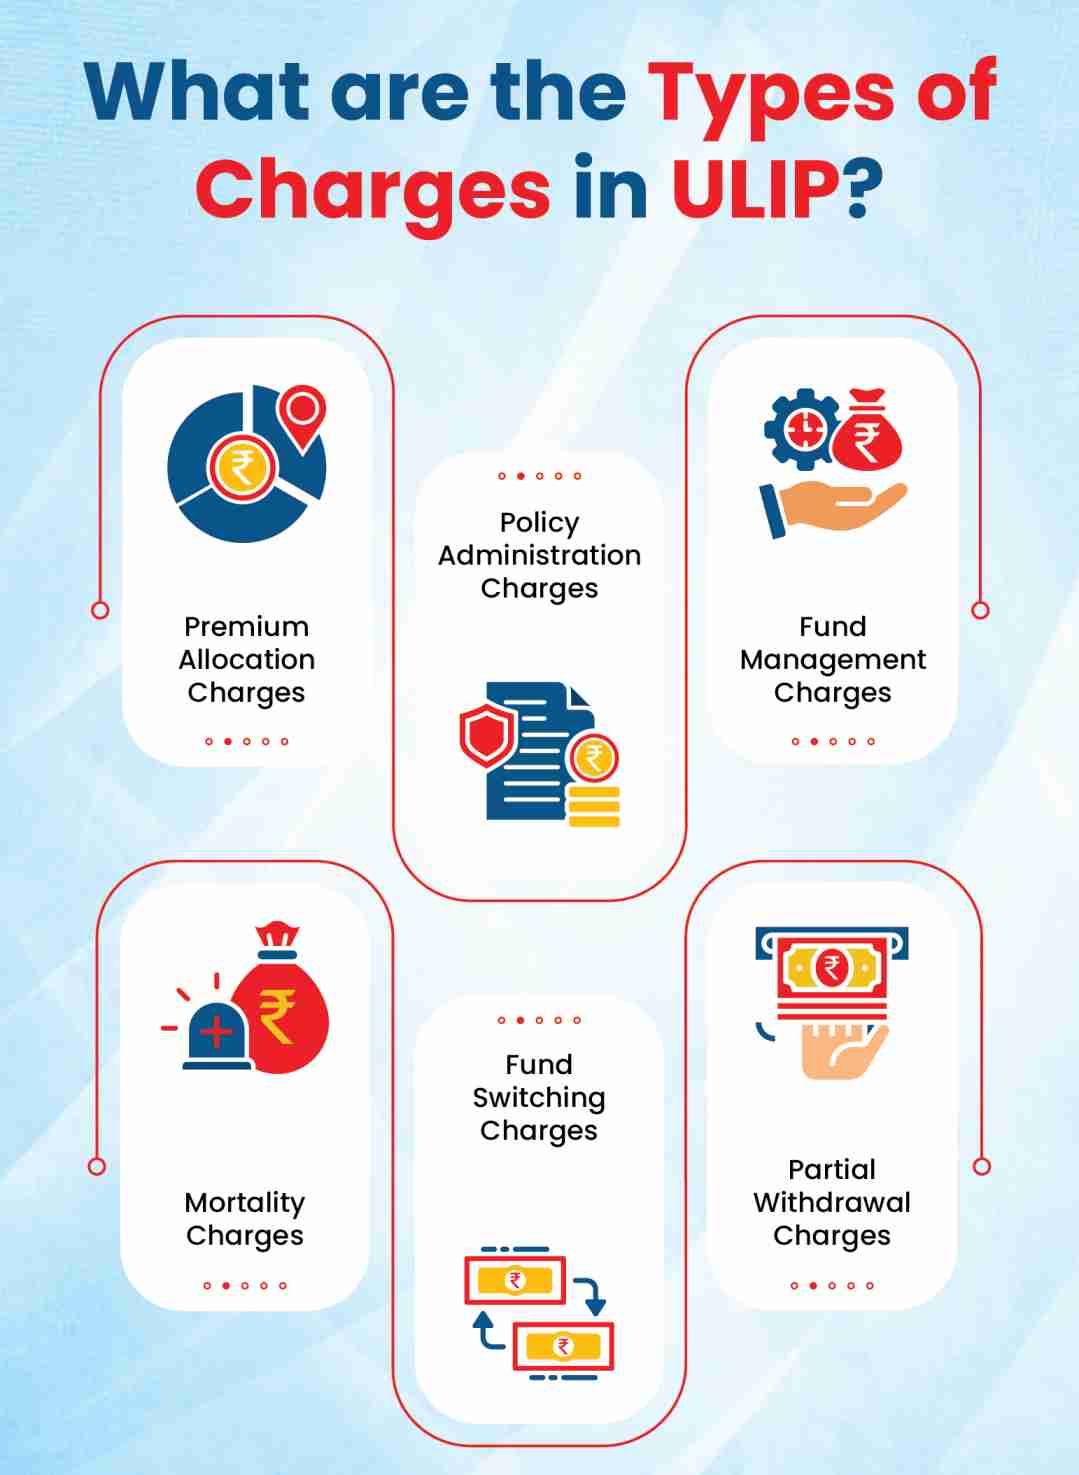
Such investments are held in the form of units, and each unit carries a Net Asset Value (NAV) that rises or falls as per market performance. Charges applicable under the policy are deducted on a regular basis, and the value of your fund keeps changing depending on how the selected funds perform.
At the time of maturity, you get the accumulated fund value, while in the scenario of any unfortunate event, your family members get the benefit as per the policy terms. This simple structure assists you in protecting your loved and dear ones and growing wealth simultaneously.
When you pay your premium, a portion is used to provide life insurance coverage throughout the policy term. The rest is directed into your selected funds, whether equity, debt or a mix of both.
The exact split can differ from plan to plan and may depend on your premium amount or policy structure. This transparent allocation lets you enjoy protection while your invested portion works toward long-term growth.
The amount invested in your chosen funds is used to buy units of those funds. Each unit carries a Net Asset Value (NAV), which keeps changing based on how the market moves. You can track such values on a regular basis to understand how your money is growing. ULIP even offer flexibility to switch between funds if you want to adjust your strategy, moving to equity for growth or debt for the purpose of stability. This keeps your investment well in line with your goals.
A ULIP offers two advantages in a single plan. First, it provides life insurance protection that keeps your family financially secure. Second, it gives you the chance to grow your money through market-linked funds. If something unfortunate happens, your family receives the insured amount or the fund value, depending on the policy terms. If you complete the policy term, you receive the value your fund has built over the years. This way, the plan safeguards as well as grows your money at the same time.
Think of ULIP as a safety net that even doubles as a long-term savings partner. It takes good care of your family members if something goes wrong while it’s building a financial corpus for your future goals, i.e., education, home purchase or retirement. No matter whether life throws a challenge or stays on track, the ULIP structure ensures that you benefit in both scenarios through protection and long-term wealth creation depending on how the market performs in long term.
In case the policyholder passes away in the course of the term of the policy, the nominee will receive the death benefit. Here, the amount is higher than the sum assured or the fund value, totally dependent on the rules and regulations of the policy. This ensures that the family members have immediate financial support at a tough time, offering stability when it is needed the most.
In case the policyholder completes the full term of the ULIP, then they avail the accumulated fund value. This value is based on the present NAV of the units that is collected over the years. A few plans permit you to take the maturity sum in lump sum form. However, the others may offer the option of getting it in instalments. Either way, this maturity benefit can assist in supporting your future life goals.
At HDFC Life, we have several ULIP Plan options, so you can find one that best meets your financial needs. Our Top Recommended Solutions Suitable for you
In Ulip Plan, the investment risks in the investment portfolio is borne by the policyholder
UIN: 101L191V02
A plan that helps you grow your investments without compromising your family’s security.
UIN: 101L191V02
A plan that helps you grow your investments without compromising your family’s security.
In Unit Linked policies, the investment risk in investment portfolio is borne by the policyholder...
In Unit Linked policies, the investment risk in investment portfolio is borne by the policyholder. The linked insurance products do not offer any liquidity during the first five years of the contract. The policyholder will not be able to surrender or withdraw the monies invested in linked insurance products completely or partially till the end of the fifth year.
In Unit Linked policies, the investment risk in investment portfolio is borne by the policyholder. The linked insurance products do not offer any liquidity during the first five years of the contract. The policyholder will not be able to surrender or withdraw the monies invested in linked insurance products completely or partially till the end of the fifth year.
UIN: 101L187V03
A Unit Linked Non-Participating Individual Life Insurance Savings Plan that addresses your long-term savings needs and also provides you protection in the form of a life cover.
UIN: 101L187V03
A Unit Linked Non-Participating Individual Life Insurance Savings Plan that addresses your long-term savings needs and also provides you protection in the form of a life cover.
In Unit Linked policies, the investment risk in investment portfolio is borne by the policyholder...
In Unit Linked policies, the investment risk in investment portfolio is borne by the policyholder. The linked insurance products do not offer any liquidity during the first five years of the contract. The policyholder will not be able to surrender or withdraw the monies invested in linked insurance products completely or partially till the end of the fifth year.
In Unit Linked policies, the investment risk in investment portfolio is borne by the policyholder. The linked insurance products do not offer any liquidity during the first five years of the contract. The policyholder will not be able to surrender or withdraw the monies invested in linked insurance products completely or partially till the end of the fifth year.
UIN: 101L180V01
A Unit Linked Non-Participating Individual Life Insurance Savings Plan with loyalty additions and multiple fund options to help you optimize your investment.
UIN: 101L180V01
A Unit Linked Non-Participating Individual Life Insurance Savings Plan with loyalty additions and multiple fund options to help you optimize your investment.
In Unit Linked policies, the investment risk in investment portfolio is borne by the policyholder...
In Unit Linked policies, the investment risk in investment portfolio is borne by the policyholder. The linked insurance products do not offer any liquidity during the first five years of the contract. The policyholder will not be able to surrender or withdraw the monies invested in linked insurance products completely or partially till the end of the fifth year.
In Unit Linked policies, the investment risk in investment portfolio is borne by the policyholder. The linked insurance products do not offer any liquidity during the first five years of the contract. The policyholder will not be able to surrender or withdraw the monies invested in linked insurance products completely or partially till the end of the fifth year.
UIN: 101L133V03
A Unit Linked Non-Participating Individual Life Insurance Savings Plan that provides dual advantage of market-linked returns along with financial protection
UIN: 101L133V03
A Unit Linked Non-Participating Individual Life Insurance Savings Plan that provides dual advantage of market-linked returns along with financial protection
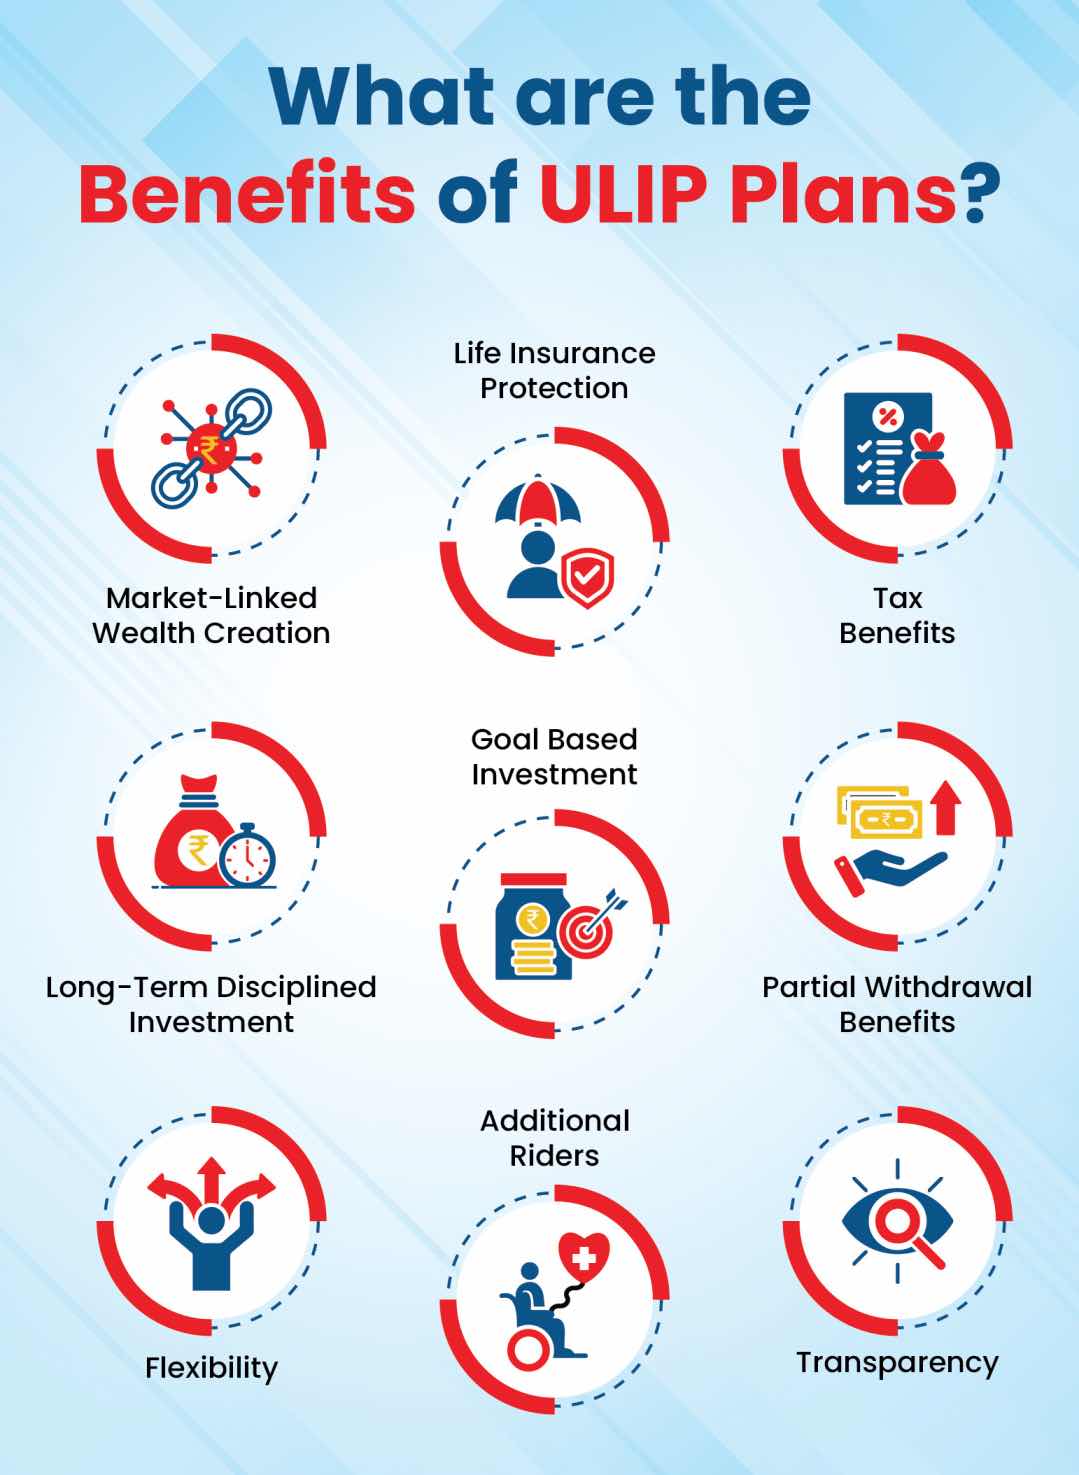
ULIPs appeal to many as they club life insurance protection with market-associated investment growth in a single plan. You get the freedom to select your funds, switch between options and track how your money is performing.
At the same time, ULIP offer tax advantages and complete visibility into charges and returns. This blend of protection, flexibility, and transparency makes ULIP a practical choice for long-term financial planning.
A ULIP gives you two benefits under a single roof. One part of your premium is headed towards ensuring that your family stays financially protected through life insurance cover. The rest of the portion is invested in equity, debt or hybrid funds, giving your money a chance to grow.
This balance of security and investment potential helps you work towards long-term goals, whether it's education, a home, or retirement, while knowing your loved ones are safeguarded throughout the journey.
Tax Benefits may be available as per the provisions of the Income-tax Act, 2025 (Corresponding Income-tax Act, 1961) as amended from time to time. Tax benefits are subject to changes in tax laws. The customer is requested to seek tax advice from his chartered accountant or personal tax advisor with respect to his personal tax liabilities under Indian Income-tax law.
Such tax advantages enhance the total plan's value. But it is essential to note that final benefits must depend on the applicable tax laws as well as individual eligibility at the time.
ULIP give you complete freedom to shape your investment in the manner you want. You can switch between equity, debt and hybrid funds depending on market trends/your risk appetite level. If you're going to invest more, then top-up options permit you to add additional investments to your policy.
Post the lock-in is over, partial withdrawals can assist you in managing urgent financial requirements with zero need for breaking your plan, having long-term time frames. This flexibility keeps you in control of your economic strategy.
ULIP have a lock-in of five years. This sets the foundation for long-term savings. This time frame assists you in staying committed to your goals and benefiting from the compounding effect as markets fluctuate.
Remaining invested for longer even assists in smoothing out market ups and downs, endowing better growth potential. With the freedom to adjust your fund choices plus add top-ups, you can refine your approach as your goals and life stages change/evolve.
One of the strengths of ULIP is their clear visibility. You can check out your fund value and NAV on a regular basis to track how your investment is performing.
Policy statements detail everything, charges deducted, units allocated and fund movement, so you are always aware of where your money is going. This level of openness assists in building trust as well as permits you to make well-informed decisions throughout the term of the policy.
ULIP plans offer a perfect mix of protection and growth, which makes them best suited for financial goals over the long term. They permit you to invest in market-associated funds while providing life cover plus tax benefits as well as flexible features. These benefits work together to support disciplined and goal-focused wealth creation.
A ULIP invests a part of your premium in equity, debt or hybrid funds, depending on your selected preference. As these funds grow with market performance, your investment has the potential to accumulate significant value over time. This long-term market participation helps you build a solid financial corpus for future goals.
Part of your premium ensures that you have life insurance coverage throughout the policy term. If something unfortunate happens, your nominee receives a death benefit, offering essential financial support during difficult times. This protection element ensures that your dependents remain secure even while your money is being invested.
Premiums paid toward ULIP may qualify for tax deductions under Section 80C* of the Income Tax Act, 1961 (old regime). The maturity value or death benefit might even be eligible for tax exemption as per Section 10(10D) of the Income Tax Act, 2025, provided the plan meets the set conditions. Such tax benefits improve financial efficiency.
The structure of a ULIP encourages consistent investing through regular premium payments. Remaining invested over the long-term period assists you in benefiting from compounded growth as well as managing market fluctuations effectively. The tax benefits as per Sections 80C* and 10(10D) of the Income Tax Act, 1961*, where applicable, add further value to your disciplined savings habit.
ULIP make it easier to plan out goals with a long-term investment time frame, like education, retirement or purchasing a home. As your money is invested in market-associated funds, it has room to grow in a steady manner over several years. With features like fund switches and partial withdrawals, ULIP permit you to make adjustments to your strategy as your needs evolve/change.
A ULIP plan is well-suited for those who want to blend wealth creation over the long term with the security of life insurance. It works best for those who can remain invested for several years and are comfortable with the idea of market-linked returns and its associated risks. As ULIP offer equity, debt and hybrid fund choices, they appeal to mid and high-risk investors looking for steady financial growth over the long term.
ULIP plan also works well for the one saving for major milestones such as a child's higher education, retirement, purchasing a home or building a long-term wealth corpus. The ability to switch funds, add top-ups and make partial withdrawals post the lock-in gives investors greater control over their financial strategy. ULIP Plan is also well-suited for those who prefer clear visibility on fund value, charges and performance, along with added tax benefits as per applicable sections of the Income Tax Act.
To sum up, a ULIP plan is a suitable option for anyone who wants discipline, flexibility and protection built into a single financial product.
Investor Profile |
Why ULIP Work for Them |
Long-term wealth builders |
Steady growth through market-linked funds over several years |
Medium to high-risk takers |
Choice of equity, debt and hybrid funds based on comfort |
Goal-based planners |
Suitable for goals like education, retirement or home purchase |
Individuals seeking protection + growth |
Life cover combined with investment opportunities |
Investors wanting flexibility |
Fund switches, top-ups and partial withdrawals after lock-in |
Tax-conscious individuals |
Potential benefits under Sections 80C* and 10(10D) of the Income Tax Act, 2025 |
Transparency-focused investors |
Clear visibility of charges, NAV and fund performance |
This combination of features makes the ULIP plan a strong choice for people who value both financial growth and long-term security.
To buy ULIP online, follow the steps given below:
Access the official website of the insurer.
Choose the ULIP policy term and the premium amount that fits your pocket.
You will be directed to the payments page.
Choose the payment mode.
Make the payment to complete the transaction.
Managing your ULIP fund in an effective manner ensures that your investment remains in line with your financial goals, having a long-term investment time frame. Begin by tracking your fund performance on a regular basis through NAV updates and policy statements.
This assists you in understanding whether your selected funds are performing as expected. ULIP even permit you to switch between equity, debt or hybrid funds, endowing you with the flexibility to adjust your strategy depending on market trends or changes in your risk appetite level.
Another beneficial tool is premium redirection, which lets you allocate future premiums to distinct funds without disturbing your prevailing units. Post the lock-in, you can even use partial withdrawals for planned needs such as education or medical expenditure, ensuring you do not disrupt your goals with long-term investment frames.
Examining your ULIP on a periodic basis assists you in making timely adjustments and staying committed to building wealth for major milestones like retirement or your child's future.
Premium redirection lets you allocate future premiums to distinct funds while keeping your current units unchanged. This is beneficial when you want to shift upcoming contributions into better-performing or suitable fund options. By adjusting where your future premiums go, you can remain aligned with your financial objectives over the long term and adapt to changing market scenarios.
Examining your ULIP every quarter or half-year ensures you remain updated on how your investment is performing. Check out NAV movements, fund reports and policy statements to understand trends. Periodic assessments assist you in identifying when a fund switch or change in allocation might be necessary to remain on the correct track with your goals.
ULIP allow you to make the switch between equity, debt and hybrid funds. This gives you control over your investment strategy. You can simply switch to safer funds as you approach essential goals and remain invested in growth-oriented funds when you have a longer time horizon. Lining up switches with your life goals and risk comfort assists in managing your ULIP effectively.
List of Funds available with this product
ULIF03501/01/10BlueChipFd101
NAV
46.5947
2026-10-09
52 wk High
2026-01-02
54.1855
52 wk Low
2026-10-08
46.0289
vs
BSE100
Note: returns over 1 year have been annualized
+0.20%
-0.20%
NAV
46.5947
2026-10-09
52 wk High
2026-01-02
54.1855
52 wk Low
2026-10-08
46.0289
vs
BSE100
Note: returns over 1 year have been annualized
+0.20%
-0.20%
NAV
46.5947
2026-10-09
52 wk High
2026-01-02
54.1855
52 wk Low
2026-10-08
46.0289
vs
BSE100
Note: returns over 1 year have been annualized
+0.20%
-0.20%
NAV
46.5947
2026-10-09
52 wk High
2026-01-02
54.1855
52 wk Low
2026-10-08
46.0289
vs
BSE100
Note: returns over 1 year have been annualized
+0.20%
-0.20%
ULIF03601/01/10OpprtntyFd101
NAV
76.1007
2026-10-09
52 wk High
2026-08-31
82.876
52 wk Low
2026-03-31
69.1143
vs
Nifty Mid Cap 100
Note: returns over 1 year have been annualized
+0.20%
-0.20%
NAV
76.1007
2026-10-09
52 wk High
2026-08-31
82.876
52 wk Low
2026-03-31
69.1143
vs
Nifty Mid Cap 100
Note: returns over 1 year have been annualized
+0.20%
-0.20%
NAV
76.1007
2026-10-09
52 wk High
2026-08-31
82.876
52 wk Low
2026-03-31
69.1143
vs
Nifty Mid Cap 100
Note: returns over 1 year have been annualized
+0.20%
-0.20%
NAV
76.1007
2026-10-09
52 wk High
2026-08-31
82.876
52 wk Low
2026-03-31
69.1143
vs
Nifty Mid Cap 100
Note: returns over 1 year have been annualized
+0.20%
-0.20%
ULIF05501/08/13DivrEqtyFd101
NAV
38.2977
2026-10-09
52 wk High
2026-01-02
44.0461
52 wk Low
2026-03-31
37.5924
vs
BSE100
Note: returns over 1 year have been annualized
+0.20%
-0.20%
NAV
38.2977
2026-10-09
52 wk High
2026-01-02
44.0461
52 wk Low
2026-03-31
37.5924
vs
BSE100
Note: returns over 1 year have been annualized
+0.20%
-0.20%
NAV
38.2977
2026-10-09
52 wk High
2026-01-02
44.0461
52 wk Low
2026-03-31
37.5924
vs
BSE100
Note: returns over 1 year have been annualized
+0.20%
-0.20%
NAV
38.2977
2026-10-09
52 wk High
2026-01-02
44.0461
52 wk Low
2026-03-31
37.5924
vs
BSE100
Note: returns over 1 year have been annualized
+0.20%
-0.20%
ULIF06618/01/18DiscvryFnd101
NAV
42.2232
2026-10-09
52 wk High
2026-08-31
45.6887
52 wk Low
2026-03-31
38.1568
vs
Nifty Mid Cap 100
Note: returns over 1 year have been annualized
+0.20%
-0.20%
NAV
42.2232
2026-10-09
52 wk High
2026-08-31
45.6887
52 wk Low
2026-03-31
38.1568
vs
Nifty Mid Cap 100
Note: returns over 1 year have been annualized
+0.20%
-0.20%
NAV
42.2232
2026-10-09
52 wk High
2026-08-31
45.6887
52 wk Low
2026-03-31
38.1568
vs
Nifty Mid Cap 100
Note: returns over 1 year have been annualized
+0.20%
-0.20%
NAV
42.2232
2026-10-09
52 wk High
2026-08-31
45.6887
52 wk Low
2026-03-31
38.1568
vs
Nifty Mid Cap 100
Note: returns over 1 year have been annualized
+0.20%
-0.20%
ULIF06723/03/18EqtyAdvtFd101
NAV
26.2062
2026-10-09
52 wk High
2026-01-02
29.6914
52 wk Low
2026-03-31
25.3814
vs
BSE200
Note: returns over 1 year have been annualized
+0.20%
-0.20%
NAV
26.2062
2026-10-09
52 wk High
2026-01-02
29.6914
52 wk Low
2026-03-31
25.3814
vs
BSE200
Note: returns over 1 year have been annualized
+0.20%
-0.20%
NAV
26.2062
2026-10-09
52 wk High
2026-01-02
29.6914
52 wk Low
2026-03-31
25.3814
vs
BSE200
Note: returns over 1 year have been annualized
+0.20%
-0.20%
NAV
26.2062
2026-10-09
52 wk High
2026-01-02
29.6914
52 wk Low
2026-03-31
25.3814
vs
BSE200
Note: returns over 1 year have been annualized
+0.20%
-0.20%
ULIF07019/07/21SustnblEqF101
NAV
13.5786
2026-10-09
52 wk High
2026-01-02
15.1515
52 wk Low
2026-03-31
12.8907
vs
Nifty 100 ESG
Note: returns over 1 year have been annualized
+0.20%
-0.20%
NAV
13.5786
2026-10-09
52 wk High
2026-01-02
15.1515
52 wk Low
2026-03-31
12.8907
vs
Nifty 100 ESG
Note: returns over 1 year have been annualized
+0.20%
-0.20%
NAV
13.5786
2026-10-09
52 wk High
2026-01-02
15.1515
52 wk Low
2026-03-31
12.8907
vs
Nifty 100 ESG
Note: returns over 1 year have been annualized
+0.20%
-0.20%
NAV
13.5786
2026-10-09
52 wk High
2026-01-02
15.1515
52 wk Low
2026-03-31
12.8907
vs
Nifty 100 ESG
Note: returns over 1 year have been annualized
+0.20%
-0.20%
ULIF07114/07/23FlexiCapFd101
NAV
14.4033
2026-10-09
52 wk High
2026-01-02
15.9756
52 wk Low
2026-03-31
13.7661
vs
NSE Nifty 500 (100%)
Note: returns over 1 year have been annualized
+0.20%
-0.20%
NAV
14.4033
2026-10-09
52 wk High
2026-01-02
15.9756
52 wk Low
2026-03-31
13.7661
vs
NSE Nifty 500 (100%)
Note: returns over 1 year have been annualized
+0.20%
-0.20%
NAV
14.4033
2026-10-09
52 wk High
2026-01-02
15.9756
52 wk Low
2026-03-31
13.7661
vs
NSE Nifty 500 (100%)
Note: returns over 1 year have been annualized
+0.20%
-0.20%
NAV
14.4033
2026-10-09
52 wk High
2026-01-02
15.9756
52 wk Low
2026-03-31
13.7661
vs
NSE Nifty 500 (100%)
Note: returns over 1 year have been annualized
+0.20%
-0.20%
ULIF07317/01/24MidCpMoIdx101
NAV
10.5625
2026-10-09
52 wk High
2026-08-31
11.3639
52 wk Low
2026-03-23
9.6684
vs
NIFTY MIDCAP150 MOMENTUM 50 (100%)
Note: returns over 1 year have been annualized
+0.20%
-0.20%
NAV
10.5625
2026-10-09
52 wk High
2026-08-31
11.3639
52 wk Low
2026-03-23
9.6684
vs
NIFTY MIDCAP150 MOMENTUM 50 (100%)
Note: returns over 1 year have been annualized
+0.20%
-0.20%
NAV
10.5625
2026-10-09
52 wk High
2026-08-31
11.3639
52 wk Low
2026-03-23
9.6684
vs
NIFTY MIDCAP150 MOMENTUM 50 (100%)
Note: returns over 1 year have been annualized
+0.20%
-0.20%
NAV
10.5625
2026-10-09
52 wk High
2026-08-31
11.3639
52 wk Low
2026-03-23
9.6684
vs
NIFTY MIDCAP150 MOMENTUM 50 (100%)
Note: returns over 1 year have been annualized
+0.20%
-0.20%
ULIF07528/05/24AlphaIdxFd101
NAV
8.5289
2026-10-09
52 wk High
2026-08-27
9.3362
52 wk Low
2026-03-31
7.5283
vs
NIFTY200 ALPHA 30
Note: returns over 1 year have been annualized
+0.20%
-0.20%
NAV
8.5289
2026-10-09
52 wk High
2026-08-27
9.3362
52 wk Low
2026-03-31
7.5283
vs
NIFTY200 ALPHA 30
Note: returns over 1 year have been annualized
+0.20%
-0.20%
NAV
8.5289
2026-10-09
52 wk High
2026-08-27
9.3362
52 wk Low
2026-03-31
7.5283
vs
NIFTY200 ALPHA 30
Note: returns over 1 year have been annualized
+0.20%
-0.20%
NAV
8.5289
2026-10-09
52 wk High
2026-08-27
9.3362
52 wk Low
2026-03-31
7.5283
vs
NIFTY200 ALPHA 30
Note: returns over 1 year have been annualized
+0.20%
-0.20%
ULIF07616/10/24Top500MoFd101
NAV
8.534
2026-10-09
52 wk High
2025-11-20
9.1631
52 wk Low
2026-03-31
7.573
vs
NIFTY500 MOMENTUM 50
Note: returns over 1 year have been annualized
+0.20%
-0.20%
NAV
8.534
2026-10-09
52 wk High
2025-11-20
9.1631
52 wk Low
2026-03-31
7.573
vs
NIFTY500 MOMENTUM 50
Note: returns over 1 year have been annualized
+0.20%
-0.20%
NAV
8.534
2026-10-09
52 wk High
2025-11-20
9.1631
52 wk Low
2026-03-31
7.573
vs
NIFTY500 MOMENTUM 50
Note: returns over 1 year have been annualized
+0.20%
-0.20%
NAV
8.534
2026-10-09
52 wk High
2025-11-20
9.1631
52 wk Low
2026-03-31
7.573
vs
NIFTY500 MOMENTUM 50
Note: returns over 1 year have been annualized
+0.20%
-0.20%
ULIF07828/02/25Alpha300Fd101
NAV
10.2063
2026-10-09
52 wk High
2026-08-28
10.8613
52 wk Low
2026-03-31
8.4127
vs
Nifty Alpha 50
Note: returns over 1 year have been annualized
+0.20%
-0.20%
NAV
10.2063
2026-10-09
52 wk High
2026-08-28
10.8613
52 wk Low
2026-03-31
8.4127
vs
Nifty Alpha 50
Note: returns over 1 year have been annualized
+0.20%
-0.20%
NAV
10.2063
2026-10-09
52 wk High
2026-08-28
10.8613
52 wk Low
2026-03-31
8.4127
vs
Nifty Alpha 50
Note: returns over 1 year have been annualized
+0.20%
-0.20%
NAV
10.2063
2026-10-09
52 wk High
2026-08-28
10.8613
52 wk Low
2026-03-31
8.4127
vs
Nifty Alpha 50
Note: returns over 1 year have been annualized
+0.20%
-0.20%
ULIF08219/09/25TopMF500Fd101
NAV
9.1202
2026-10-09
52 wk High
2026-02-26
10.4429
52 wk Low
2026-10-08
9.0417
vs
NIFTY500 MULTIFACTOR MQVLV 50
Note: returns over 1 year have been annualized
+0.20%
-0.20%
NAV
9.1202
2026-10-09
52 wk High
2026-02-26
10.4429
52 wk Low
2026-10-08
9.0417
vs
NIFTY500 MULTIFACTOR MQVLV 50
Note: returns over 1 year have been annualized
+0.20%
-0.20%
NAV
9.1202
2026-10-09
52 wk High
2026-02-26
10.4429
52 wk Low
2026-10-08
9.0417
vs
NIFTY500 MULTIFACTOR MQVLV 50
Note: returns over 1 year have been annualized
+0.20%
-0.20%
NAV
9.1202
2026-10-09
52 wk High
2026-02-26
10.4429
52 wk Low
2026-10-08
9.0417
vs
NIFTY500 MULTIFACTOR MQVLV 50
Note: returns over 1 year have been annualized
+0.20%
-0.20%
ULIF08421/11/25InCnsmAdFd101
NAV
9.0086
2026-10-09
52 wk High
2025-12-22
10.0205
52 wk Low
2026-03-31
8.4557
vs
Nifty India Consumption
Note: returns over 1 year have been annualized
+0.20%
-0.20%
NAV
9.0086
2026-10-09
52 wk High
2025-12-22
10.0205
52 wk Low
2026-03-31
8.4557
vs
Nifty India Consumption
Note: returns over 1 year have been annualized
+0.20%
-0.20%
NAV
9.0086
2026-10-09
52 wk High
2025-12-22
10.0205
52 wk Low
2026-03-31
8.4557
vs
Nifty India Consumption
Note: returns over 1 year have been annualized
+0.20%
-0.20%
NAV
9.0086
2026-10-09
52 wk High
2025-12-22
10.0205
52 wk Low
2026-03-31
8.4557
vs
Nifty India Consumption
Note: returns over 1 year have been annualized
+0.20%
-0.20%
ULIF08602/03/26InSctrLrFd101
NAV
9.9997
2026-10-09
52 wk High
2026-08-03
11.0601
52 wk Low
2026-03-31
9.6626
vs
BSE India Sector Leaders ( Customised)
Note: returns over 1 year have been annualized
+0.20%
-0.20%
NAV
9.9997
2026-10-09
52 wk High
2026-08-03
11.0601
52 wk Low
2026-03-31
9.6626
vs
BSE India Sector Leaders ( Customised)
Note: returns over 1 year have been annualized
+0.20%
-0.20%
NAV
9.9997
2026-10-09
52 wk High
2026-08-03
11.0601
52 wk Low
2026-03-31
9.6626
vs
BSE India Sector Leaders ( Customised)
Note: returns over 1 year have been annualized
+0.20%
-0.20%
NAV
9.9997
2026-10-09
52 wk High
2026-08-03
11.0601
52 wk Low
2026-03-31
9.6626
vs
BSE India Sector Leaders ( Customised)
Note: returns over 1 year have been annualized
+0.20%
-0.20%
ULIF08801/06/26SmtVal50Fd101
NAV
9.1256
2026-10-09
52 wk High
2026-06-16
10
52 wk Low
2026-10-08
9.0319
vs
BSE 500 Enhanced Value 50 (Customised)
Note: returns over 1 year have been annualized
+0.20%
-0.20%
NAV
9.1256
2026-10-09
52 wk High
2026-06-16
10
52 wk Low
2026-10-08
9.0319
vs
BSE 500 Enhanced Value 50 (Customised)
Note: returns over 1 year have been annualized
+0.20%
-0.20%
NAV
9.1256
2026-10-09
52 wk High
2026-06-16
10
52 wk Low
2026-10-08
9.0319
vs
BSE 500 Enhanced Value 50 (Customised)
Note: returns over 1 year have been annualized
+0.20%
-0.20%
NAV
9.1256
2026-10-09
52 wk High
2026-06-16
10
52 wk Low
2026-10-08
9.0319
vs
BSE 500 Enhanced Value 50 (Customised)
Note: returns over 1 year have been annualized
+0.20%
-0.20%
ULIF09004/09/26DivLdrAdFd101
NAV
9.5073
2026-10-09
52 wk High
2026-09-23
10.031
52 wk Low
2026-10-08
9.3998
vs
BSE 500 Dividend Leaders 50 (Customised)
Note: returns over 1 year have been annualized
+0.20%
-0.20%
NAV
9.5073
2026-10-09
52 wk High
2026-09-23
10.031
52 wk Low
2026-10-08
9.3998
vs
BSE 500 Dividend Leaders 50 (Customised)
Note: returns over 1 year have been annualized
+0.20%
-0.20%
NAV
9.5073
2026-10-09
52 wk High
2026-09-23
10.031
52 wk Low
2026-10-08
9.3998
vs
BSE 500 Dividend Leaders 50 (Customised)
Note: returns over 1 year have been annualized
+0.20%
-0.20%
NAV
9.5073
2026-10-09
52 wk High
2026-09-23
10.031
52 wk Low
2026-10-08
9.3998
vs
BSE 500 Dividend Leaders 50 (Customised)
Note: returns over 1 year have been annualized
+0.20%
-0.20%
* Data as of 31st January 2026. Past Performance is not indicative of future performance of the fund.
NAV
29.4937
17.09.2020
52 week High
07.02.2020
52 week Low
23.03.2020
* Data as of 31st January 2026. Past Performance is not indicative of future performance of the fund.
* Data as of 31st January 2026. Past Performance is not indicative of future performance of the fund.
ULIF09216/09/26T200EqWtFd101
NAV
9.9303
2026-10-09
52 wk High
2026-10-06
10.1144
52 wk Low
2026-10-08
9.8168
vs
Note: returns over 1 year have been annualized
+0.20%
-0.20%
ULIF03501/01/10BlueChipFd101
NAV
46.5947
2026-10-09
52 wk High
2026-01-02
54.1855
52 wk Low
2026-10-08
46.0289
vs
Note: returns over 1 year have been annualized
+0.20%
-0.20%
ULIF03601/01/10OpprtntyFd101
NAV
76.1007
2026-10-09
52 wk High
2026-08-31
82.876
52 wk Low
2026-03-31
69.1143
vs
Note: returns over 1 year have been annualized
+0.20%
-0.20%
ULIF05501/08/13DivrEqtyFd101
NAV
38.2977
2026-10-09
52 wk High
2026-01-02
44.0461
52 wk Low
2026-03-31
37.5924
vs
Note: returns over 1 year have been annualized
+0.20%
-0.20%
ULIF06618/01/18DiscvryFnd101
NAV
42.2232
2026-10-09
52 wk High
2026-08-31
45.6887
52 wk Low
2026-03-31
38.1568
vs
Note: returns over 1 year have been annualized
+0.20%
-0.20%
ULIF06723/03/18EqtyAdvtFd101
NAV
26.2062
2026-10-09
52 wk High
2026-01-02
29.6914
52 wk Low
2026-03-31
25.3814
vs
Note: returns over 1 year have been annualized
+0.20%
-0.20%
ULIF07019/07/21SustnblEqF101
NAV
13.5786
2026-10-09
52 wk High
2026-01-02
15.1515
52 wk Low
2026-03-31
12.8907
vs
Note: returns over 1 year have been annualized
+0.20%
-0.20%
ULIF07114/07/23FlexiCapFd101
NAV
14.4033
2026-10-09
52 wk High
2026-01-02
15.9756
52 wk Low
2026-03-31
13.7661
vs
Note: returns over 1 year have been annualized
+0.20%
-0.20%
ULIF07317/01/24MidCpMoIdx101
NAV
10.5625
2026-10-09
52 wk High
2026-08-31
11.3639
52 wk Low
2026-03-23
9.6684
vs
Note: returns over 1 year have been annualized
+0.20%
-0.20%
ULIF07528/05/24AlphaIdxFd101
NAV
8.5289
2026-10-09
52 wk High
2026-08-27
9.3362
52 wk Low
2026-03-31
7.5283
vs
Note: returns over 1 year have been annualized
+0.20%
-0.20%
ULIF07616/10/24Top500MoFd101
NAV
8.534
2026-10-09
52 wk High
2025-11-20
9.1631
52 wk Low
2026-03-31
7.573
vs
Note: returns over 1 year have been annualized
+0.20%
-0.20%
ULIF07828/02/25Alpha300Fd101
NAV
10.2063
2026-10-09
52 wk High
2026-08-28
10.8613
52 wk Low
2026-03-31
8.4127
vs
Note: returns over 1 year have been annualized
+0.20%
-0.20%
ULIF08219/09/25TopMF500Fd101
NAV
9.1202
2026-10-09
52 wk High
2026-02-26
10.4429
52 wk Low
2026-10-08
9.0417
vs
Note: returns over 1 year have been annualized
+0.20%
-0.20%
ULIF08421/11/25InCnsmAdFd101
NAV
9.0086
2026-10-09
52 wk High
2025-12-22
10.0205
52 wk Low
2026-03-31
8.4557
vs
Note: returns over 1 year have been annualized
+0.20%
-0.20%
ULIF08602/03/26InSctrLrFd101
NAV
9.9997
2026-10-09
52 wk High
2026-08-03
11.0601
52 wk Low
2026-03-31
9.6626
vs
Note: returns over 1 year have been annualized
+0.20%
-0.20%
ULIF08801/06/26SmtVal50Fd101
NAV
9.1256
2026-10-09
52 wk High
2026-06-16
10
52 wk Low
2026-10-08
9.0319
vs
Note: returns over 1 year have been annualized
+0.20%
-0.20%
ULIF09004/09/26DivLdrAdFd101
NAV
9.5073
2026-10-09
52 wk High
2026-09-23
10.031
52 wk Low
2026-10-08
9.3998
vs
Note: returns over 1 year have been annualized
+0.20%
-0.20%
* Data as of 31st January 2026. Past Performance is not indicative of future performance of the fund.
ULIF00102/01/04LiquidFund101
NAV
84.8221
2026-10-09
52 wk High
2026-10-09
84.8221
52 wk Low
2025-10-10
80.2803
vs
CRISIL Liquid Fund Index
Note: returns over 1 year have been annualized
+0.20%
-0.20%
NAV
84.8221
2026-10-09
52 wk High
2026-10-09
84.8221
52 wk Low
2025-10-10
80.2803
vs
CRISIL Liquid Fund Index
Note: returns over 1 year have been annualized
+0.20%
-0.20%
NAV
84.8221
2026-10-09
52 wk High
2026-10-09
84.8221
52 wk Low
2025-10-10
80.2803
vs
CRISIL Liquid Fund Index
Note: returns over 1 year have been annualized
+0.20%
-0.20%
NAV
84.8221
2026-10-09
52 wk High
2026-10-09
84.8221
52 wk Low
2025-10-10
80.2803
vs
CRISIL Liquid Fund Index
Note: returns over 1 year have been annualized
+0.20%
-0.20%
ULIF05601/08/13Bond Funds101
NAV
21.6938
2026-10-09
52 wk High
2026-08-14
21.9854
52 wk Low
2026-04-02
21.1566
vs
CRISIL Composite Bond Fund Index
Note: returns over 1 year have been annualized
+0.20%
-0.20%
NAV
21.6938
2026-10-09
52 wk High
2026-08-14
21.9854
52 wk Low
2026-04-02
21.1566
vs
CRISIL Composite Bond Fund Index
Note: returns over 1 year have been annualized
+0.20%
-0.20%
NAV
21.6938
2026-10-09
52 wk High
2026-08-14
21.9854
52 wk Low
2026-04-02
21.1566
vs
CRISIL Composite Bond Fund Index
Note: returns over 1 year have been annualized
+0.20%
-0.20%
NAV
21.6938
2026-10-09
52 wk High
2026-08-14
21.9854
52 wk Low
2026-04-02
21.1566
vs
CRISIL Composite Bond Fund Index
Note: returns over 1 year have been annualized
+0.20%
-0.20%
ULIF06814/06/19BondPlusFd101
NAV
15.28
2026-10-09
52 wk High
2026-08-14
15.384
52 wk Low
2026-04-02
14.8406
vs
CRISIL Composite Bond Fund Index
Note: returns over 1 year have been annualized
+0.20%
-0.20%
NAV
15.28
2026-10-09
52 wk High
2026-08-14
15.384
52 wk Low
2026-04-02
14.8406
vs
CRISIL Composite Bond Fund Index
Note: returns over 1 year have been annualized
+0.20%
-0.20%
NAV
15.28
2026-10-09
52 wk High
2026-08-14
15.384
52 wk Low
2026-04-02
14.8406
vs
CRISIL Composite Bond Fund Index
Note: returns over 1 year have been annualized
+0.20%
-0.20%
NAV
15.28
2026-10-09
52 wk High
2026-08-14
15.384
52 wk Low
2026-04-02
14.8406
vs
CRISIL Composite Bond Fund Index
Note: returns over 1 year have been annualized
+0.20%
-0.20%
* Data as of 31st January 2026. Past Performance is not indicative of future performance of the fund.
NAV
29.4937
17.09.2020
52 week High
07.02.2020
52 week Low
23.03.2020
* Data as of 31st January 2026. Past Performance is not indicative of future performance of the fund.
* Data as of 31st January 2026. Past Performance is not indicative of future performance of the fund.
ULIF00102/01/04LiquidFund101
NAV
84.8221
2026-10-09
52 wk High
2026-10-09
84.8221
52 wk Low
2025-10-10
80.2803
vs
Note: returns over 1 year have been annualized
+0.20%
-0.20%
ULIF05601/08/13Bond Funds101
NAV
21.6938
2026-10-09
52 wk High
2026-08-14
21.9854
52 wk Low
2026-04-02
21.1566
vs
Note: returns over 1 year have been annualized
+0.20%
-0.20%
* Data as of 31st January 2026. Past Performance is not indicative of future performance of the fund.
ULIF03901/09/10BalancedFd101
NAV
39.3021
2026-10-09
52 wk High
2026-01-02
41.5509
52 wk Low
2026-03-30
37.267
vs
60% BSE100 40% CRISIL Composite Bond Fund Index
Note: returns over 1 year have been annualized
+0.20%
-0.20%
NAV
39.3021
2026-10-09
52 wk High
2026-01-02
41.5509
52 wk Low
2026-03-30
37.267
vs
60% BSE100 40% CRISIL Composite Bond Fund Index
Note: returns over 1 year have been annualized
+0.20%
-0.20%
NAV
39.3021
2026-10-09
52 wk High
2026-01-02
41.5509
52 wk Low
2026-03-30
37.267
vs
60% BSE100 40% CRISIL Composite Bond Fund Index
Note: returns over 1 year have been annualized
+0.20%
-0.20%
NAV
39.3021
2026-10-09
52 wk High
2026-01-02
41.5509
52 wk Low
2026-03-30
37.267
vs
60% BSE100 40% CRISIL Composite Bond Fund Index
Note: returns over 1 year have been annualized
+0.20%
-0.20%
ULIF06914/06/19SecAdvFund101
NAV
15.0753
2026-10-09
52 wk High
2026-08-14
15.2588
52 wk Low
2026-04-02
14.6424
vs
CRISIL Composite Bond Fund Index
Note: returns over 1 year have been annualized
+0.20%
-0.20%
NAV
15.0753
2026-10-09
52 wk High
2026-08-14
15.2588
52 wk Low
2026-04-02
14.6424
vs
CRISIL Composite Bond Fund Index
Note: returns over 1 year have been annualized
+0.20%
-0.20%
NAV
15.0753
2026-10-09
52 wk High
2026-08-14
15.2588
52 wk Low
2026-04-02
14.6424
vs
CRISIL Composite Bond Fund Index
Note: returns over 1 year have been annualized
+0.20%
-0.20%
NAV
15.0753
2026-10-09
52 wk High
2026-08-14
15.2588
52 wk Low
2026-04-02
14.6424
vs
CRISIL Composite Bond Fund Index
Note: returns over 1 year have been annualized
+0.20%
-0.20%
ULIF08028/02/25DynamicFnd101
NAV
10.1436
2026-10-09
52 wk High
2026-01-02
11.2703
52 wk Low
2026-03-30
9.8481
vs
Nifty 50 (80%) And Crisil Composite Bond Index (20%)
Note: returns over 1 year have been annualized
+0.20%
-0.20%
NAV
10.1436
2026-10-09
52 wk High
2026-01-02
11.2703
52 wk Low
2026-03-30
9.8481
vs
Nifty 50 (80%) And Crisil Composite Bond Index (20%)
Note: returns over 1 year have been annualized
+0.20%
-0.20%
NAV
10.1436
2026-10-09
52 wk High
2026-01-02
11.2703
52 wk Low
2026-03-30
9.8481
vs
Nifty 50 (80%) And Crisil Composite Bond Index (20%)
Note: returns over 1 year have been annualized
+0.20%
-0.20%
NAV
10.1436
2026-10-09
52 wk High
2026-01-02
11.2703
52 wk Low
2026-03-30
9.8481
vs
Nifty 50 (80%) And Crisil Composite Bond Index (20%)
Note: returns over 1 year have been annualized
+0.20%
-0.20%
* Data as of 31st January 2026. Past Performance is not indicative of future performance of the fund.
NAV
29.4937
17.09.2020
52 week High
07.02.2020
52 week Low
23.03.2020
* Data as of 31st January 2026. Past Performance is not indicative of future performance of the fund.
* Data as of 31st January 2026. Past Performance is not indicative of future performance of the fund.
ULIF03901/09/10BalancedFd101
NAV
39.3021
2026-10-09
52 wk High
2026-01-02
41.5509
52 wk Low
2026-03-30
37.267
vs
Note: returns over 1 year have been annualized
+0.20%
-0.20%
ULIF06914/06/19SecAdvFund101
NAV
15.0753
2026-10-09
52 wk High
2026-08-14
15.2588
52 wk Low
2026-04-02
14.6424
vs
Note: returns over 1 year have been annualized
+0.20%
-0.20%
* Data as of 31st January 2026. Past Performance is not indicative of future performance of the fund.
ULIF03501/01/10BlueChipFd101
NAV
46.5947
2026-10-09
52 wk High
2026-01-02
54.1855
52 wk Low
2026-10-08
46.0289
vs
BSE100
Note: returns over 1 year have been annualized
+0.20%
-0.20%
NAV
46.5947
2026-10-09
52 wk High
2026-01-02
54.1855
52 wk Low
2026-10-08
46.0289
vs
BSE100
Note: returns over 1 year have been annualized
+0.20%
-0.20%
NAV
46.5947
2026-10-09
52 wk High
2026-01-02
54.1855
52 wk Low
2026-10-08
46.0289
vs
BSE100
Note: returns over 1 year have been annualized
+0.20%
-0.20%
NAV
46.5947
2026-10-09
52 wk High
2026-01-02
54.1855
52 wk Low
2026-10-08
46.0289
vs
BSE100
Note: returns over 1 year have been annualized
+0.20%
-0.20%
ULIF00102/01/04LiquidFund101
NAV
84.8221
2026-10-09
52 wk High
2026-10-09
84.8221
52 wk Low
2025-10-10
80.2803
vs
CRISIL Liquid Fund Index
Note: returns over 1 year have been annualized
+0.20%
-0.20%
NAV
84.8221
2026-10-09
52 wk High
2026-10-09
84.8221
52 wk Low
2025-10-10
80.2803
vs
CRISIL Liquid Fund Index
Note: returns over 1 year have been annualized
+0.20%
-0.20%
NAV
84.8221
2026-10-09
52 wk High
2026-10-09
84.8221
52 wk Low
2025-10-10
80.2803
vs
CRISIL Liquid Fund Index
Note: returns over 1 year have been annualized
+0.20%
-0.20%
NAV
84.8221
2026-10-09
52 wk High
2026-10-09
84.8221
52 wk Low
2025-10-10
80.2803
vs
CRISIL Liquid Fund Index
Note: returns over 1 year have been annualized
+0.20%
-0.20%
ULIF03601/01/10OpprtntyFd101
NAV
76.1007
2026-10-09
52 wk High
2026-08-31
82.876
52 wk Low
2026-03-31
69.1143
vs
Nifty Mid Cap 100
Note: returns over 1 year have been annualized
+0.20%
-0.20%
NAV
76.1007
2026-10-09
52 wk High
2026-08-31
82.876
52 wk Low
2026-03-31
69.1143
vs
Nifty Mid Cap 100
Note: returns over 1 year have been annualized
+0.20%
-0.20%
NAV
76.1007
2026-10-09
52 wk High
2026-08-31
82.876
52 wk Low
2026-03-31
69.1143
vs
Nifty Mid Cap 100
Note: returns over 1 year have been annualized
+0.20%
-0.20%
NAV
76.1007
2026-10-09
52 wk High
2026-08-31
82.876
52 wk Low
2026-03-31
69.1143
vs
Nifty Mid Cap 100
Note: returns over 1 year have been annualized
+0.20%
-0.20%
ULIF03901/09/10BalancedFd101
NAV
39.3021
2026-10-09
52 wk High
2026-01-02
41.5509
52 wk Low
2026-03-30
37.267
vs
60% BSE100 40% CRISIL Composite Bond Fund Index
Note: returns over 1 year have been annualized
+0.20%
-0.20%
NAV
39.3021
2026-10-09
52 wk High
2026-01-02
41.5509
52 wk Low
2026-03-30
37.267
vs
60% BSE100 40% CRISIL Composite Bond Fund Index
Note: returns over 1 year have been annualized
+0.20%
-0.20%
NAV
39.3021
2026-10-09
52 wk High
2026-01-02
41.5509
52 wk Low
2026-03-30
37.267
vs
60% BSE100 40% CRISIL Composite Bond Fund Index
Note: returns over 1 year have been annualized
+0.20%
-0.20%
NAV
39.3021
2026-10-09
52 wk High
2026-01-02
41.5509
52 wk Low
2026-03-30
37.267
vs
60% BSE100 40% CRISIL Composite Bond Fund Index
Note: returns over 1 year have been annualized
+0.20%
-0.20%
ULIF05501/08/13DivrEqtyFd101
NAV
38.2977
2026-10-09
52 wk High
2026-01-02
44.0461
52 wk Low
2026-03-31
37.5924
vs
BSE100
Note: returns over 1 year have been annualized
+0.20%
-0.20%
NAV
38.2977
2026-10-09
52 wk High
2026-01-02
44.0461
52 wk Low
2026-03-31
37.5924
vs
BSE100
Note: returns over 1 year have been annualized
+0.20%
-0.20%
NAV
38.2977
2026-10-09
52 wk High
2026-01-02
44.0461
52 wk Low
2026-03-31
37.5924
vs
BSE100
Note: returns over 1 year have been annualized
+0.20%
-0.20%
NAV
38.2977
2026-10-09
52 wk High
2026-01-02
44.0461
52 wk Low
2026-03-31
37.5924
vs
BSE100
Note: returns over 1 year have been annualized
+0.20%
-0.20%
ULIF05601/08/13Bond Funds101
NAV
21.6938
2026-10-09
52 wk High
2026-08-14
21.9854
52 wk Low
2026-04-02
21.1566
vs
CRISIL Composite Bond Fund Index
Note: returns over 1 year have been annualized
+0.20%
-0.20%
NAV
21.6938
2026-10-09
52 wk High
2026-08-14
21.9854
52 wk Low
2026-04-02
21.1566
vs
CRISIL Composite Bond Fund Index
Note: returns over 1 year have been annualized
+0.20%
-0.20%
NAV
21.6938
2026-10-09
52 wk High
2026-08-14
21.9854
52 wk Low
2026-04-02
21.1566
vs
CRISIL Composite Bond Fund Index
Note: returns over 1 year have been annualized
+0.20%
-0.20%
NAV
21.6938
2026-10-09
52 wk High
2026-08-14
21.9854
52 wk Low
2026-04-02
21.1566
vs
CRISIL Composite Bond Fund Index
Note: returns over 1 year have been annualized
+0.20%
-0.20%
ULIF06618/01/18DiscvryFnd101
NAV
42.2232
2026-10-09
52 wk High
2026-08-31
45.6887
52 wk Low
2026-03-31
38.1568
vs
Nifty Mid Cap 100
Note: returns over 1 year have been annualized
+0.20%
-0.20%
NAV
42.2232
2026-10-09
52 wk High
2026-08-31
45.6887
52 wk Low
2026-03-31
38.1568
vs
Nifty Mid Cap 100
Note: returns over 1 year have been annualized
+0.20%
-0.20%
NAV
42.2232
2026-10-09
52 wk High
2026-08-31
45.6887
52 wk Low
2026-03-31
38.1568
vs
Nifty Mid Cap 100
Note: returns over 1 year have been annualized
+0.20%
-0.20%
NAV
42.2232
2026-10-09
52 wk High
2026-08-31
45.6887
52 wk Low
2026-03-31
38.1568
vs
Nifty Mid Cap 100
Note: returns over 1 year have been annualized
+0.20%
-0.20%
ULIF06723/03/18EqtyAdvtFd101
NAV
26.2062
2026-10-09
52 wk High
2026-01-02
29.6914
52 wk Low
2026-03-31
25.3814
vs
BSE200
Note: returns over 1 year have been annualized
+0.20%
-0.20%
NAV
26.2062
2026-10-09
52 wk High
2026-01-02
29.6914
52 wk Low
2026-03-31
25.3814
vs
BSE200
Note: returns over 1 year have been annualized
+0.20%
-0.20%
NAV
26.2062
2026-10-09
52 wk High
2026-01-02
29.6914
52 wk Low
2026-03-31
25.3814
vs
BSE200
Note: returns over 1 year have been annualized
+0.20%
-0.20%
NAV
26.2062
2026-10-09
52 wk High
2026-01-02
29.6914
52 wk Low
2026-03-31
25.3814
vs
BSE200
Note: returns over 1 year have been annualized
+0.20%
-0.20%
ULIF06814/06/19BondPlusFd101
NAV
15.28
2026-10-09
52 wk High
2026-08-14
15.384
52 wk Low
2026-04-02
14.8406
vs
CRISIL Composite Bond Fund Index
Note: returns over 1 year have been annualized
+0.20%
-0.20%
NAV
15.28
2026-10-09
52 wk High
2026-08-14
15.384
52 wk Low
2026-04-02
14.8406
vs
CRISIL Composite Bond Fund Index
Note: returns over 1 year have been annualized
+0.20%
-0.20%
NAV
15.28
2026-10-09
52 wk High
2026-08-14
15.384
52 wk Low
2026-04-02
14.8406
vs
CRISIL Composite Bond Fund Index
Note: returns over 1 year have been annualized
+0.20%
-0.20%
NAV
15.28
2026-10-09
52 wk High
2026-08-14
15.384
52 wk Low
2026-04-02
14.8406
vs
CRISIL Composite Bond Fund Index
Note: returns over 1 year have been annualized
+0.20%
-0.20%
ULIF06914/06/19SecAdvFund101
NAV
15.0753
2026-10-09
52 wk High
2026-08-14
15.2588
52 wk Low
2026-04-02
14.6424
vs
CRISIL Composite Bond Fund Index
Note: returns over 1 year have been annualized
+0.20%
-0.20%
NAV
15.0753
2026-10-09
52 wk High
2026-08-14
15.2588
52 wk Low
2026-04-02
14.6424
vs
CRISIL Composite Bond Fund Index
Note: returns over 1 year have been annualized
+0.20%
-0.20%
NAV
15.0753
2026-10-09
52 wk High
2026-08-14
15.2588
52 wk Low
2026-04-02
14.6424
vs
CRISIL Composite Bond Fund Index
Note: returns over 1 year have been annualized
+0.20%
-0.20%
NAV
15.0753
2026-10-09
52 wk High
2026-08-14
15.2588
52 wk Low
2026-04-02
14.6424
vs
CRISIL Composite Bond Fund Index
Note: returns over 1 year have been annualized
+0.20%
-0.20%
ULIF07019/07/21SustnblEqF101
NAV
13.5786
2026-10-09
52 wk High
2026-01-02
15.1515
52 wk Low
2026-03-31
12.8907
vs
Nifty 100 ESG
Note: returns over 1 year have been annualized
+0.20%
-0.20%
NAV
13.5786
2026-10-09
52 wk High
2026-01-02
15.1515
52 wk Low
2026-03-31
12.8907
vs
Nifty 100 ESG
Note: returns over 1 year have been annualized
+0.20%
-0.20%
NAV
13.5786
2026-10-09
52 wk High
2026-01-02
15.1515
52 wk Low
2026-03-31
12.8907
vs
Nifty 100 ESG
Note: returns over 1 year have been annualized
+0.20%
-0.20%
NAV
13.5786
2026-10-09
52 wk High
2026-01-02
15.1515
52 wk Low
2026-03-31
12.8907
vs
Nifty 100 ESG
Note: returns over 1 year have been annualized
+0.20%
-0.20%
ULIF07114/07/23FlexiCapFd101
NAV
14.4033
2026-10-09
52 wk High
2026-01-02
15.9756
52 wk Low
2026-03-31
13.7661
vs
NSE Nifty 500 (100%)
Note: returns over 1 year have been annualized
+0.20%
-0.20%
NAV
14.4033
2026-10-09
52 wk High
2026-01-02
15.9756
52 wk Low
2026-03-31
13.7661
vs
NSE Nifty 500 (100%)
Note: returns over 1 year have been annualized
+0.20%
-0.20%
NAV
14.4033
2026-10-09
52 wk High
2026-01-02
15.9756
52 wk Low
2026-03-31
13.7661
vs
NSE Nifty 500 (100%)
Note: returns over 1 year have been annualized
+0.20%
-0.20%
NAV
14.4033
2026-10-09
52 wk High
2026-01-02
15.9756
52 wk Low
2026-03-31
13.7661
vs
NSE Nifty 500 (100%)
Note: returns over 1 year have been annualized
+0.20%
-0.20%
ULIF07317/01/24MidCpMoIdx101
NAV
10.5625
2026-10-09
52 wk High
2026-08-31
11.3639
52 wk Low
2026-03-23
9.6684
vs
NIFTY MIDCAP150 MOMENTUM 50 (100%)
Note: returns over 1 year have been annualized
+0.20%
-0.20%
NAV
10.5625
2026-10-09
52 wk High
2026-08-31
11.3639
52 wk Low
2026-03-23
9.6684
vs
NIFTY MIDCAP150 MOMENTUM 50 (100%)
Note: returns over 1 year have been annualized
+0.20%
-0.20%
NAV
10.5625
2026-10-09
52 wk High
2026-08-31
11.3639
52 wk Low
2026-03-23
9.6684
vs
NIFTY MIDCAP150 MOMENTUM 50 (100%)
Note: returns over 1 year have been annualized
+0.20%
-0.20%
NAV
10.5625
2026-10-09
52 wk High
2026-08-31
11.3639
52 wk Low
2026-03-23
9.6684
vs
NIFTY MIDCAP150 MOMENTUM 50 (100%)
Note: returns over 1 year have been annualized
+0.20%
-0.20%
ULIF07528/05/24AlphaIdxFd101
NAV
8.5289
2026-10-09
52 wk High
2026-08-27
9.3362
52 wk Low
2026-03-31
7.5283
vs
NIFTY200 ALPHA 30
Note: returns over 1 year have been annualized
+0.20%
-0.20%
NAV
8.5289
2026-10-09
52 wk High
2026-08-27
9.3362
52 wk Low
2026-03-31
7.5283
vs
NIFTY200 ALPHA 30
Note: returns over 1 year have been annualized
+0.20%
-0.20%
NAV
8.5289
2026-10-09
52 wk High
2026-08-27
9.3362
52 wk Low
2026-03-31
7.5283
vs
NIFTY200 ALPHA 30
Note: returns over 1 year have been annualized
+0.20%
-0.20%
NAV
8.5289
2026-10-09
52 wk High
2026-08-27
9.3362
52 wk Low
2026-03-31
7.5283
vs
NIFTY200 ALPHA 30
Note: returns over 1 year have been annualized
+0.20%
-0.20%
ULIF07616/10/24Top500MoFd101
NAV
8.534
2026-10-09
52 wk High
2025-11-20
9.1631
52 wk Low
2026-03-31
7.573
vs
NIFTY500 MOMENTUM 50
Note: returns over 1 year have been annualized
+0.20%
-0.20%
NAV
8.534
2026-10-09
52 wk High
2025-11-20
9.1631
52 wk Low
2026-03-31
7.573
vs
NIFTY500 MOMENTUM 50
Note: returns over 1 year have been annualized
+0.20%
-0.20%
NAV
8.534
2026-10-09
52 wk High
2025-11-20
9.1631
52 wk Low
2026-03-31
7.573
vs
NIFTY500 MOMENTUM 50
Note: returns over 1 year have been annualized
+0.20%
-0.20%
NAV
8.534
2026-10-09
52 wk High
2025-11-20
9.1631
52 wk Low
2026-03-31
7.573
vs
NIFTY500 MOMENTUM 50
Note: returns over 1 year have been annualized
+0.20%
-0.20%
ULIF08028/02/25DynamicFnd101
NAV
10.1436
2026-10-09
52 wk High
2026-01-02
11.2703
52 wk Low
2026-03-30
9.8481
vs
Nifty 50 (80%) And Crisil Composite Bond Index (20%)
Note: returns over 1 year have been annualized
+0.20%
-0.20%
NAV
10.1436
2026-10-09
52 wk High
2026-01-02
11.2703
52 wk Low
2026-03-30
9.8481
vs
Nifty 50 (80%) And Crisil Composite Bond Index (20%)
Note: returns over 1 year have been annualized
+0.20%
-0.20%
NAV
10.1436
2026-10-09
52 wk High
2026-01-02
11.2703
52 wk Low
2026-03-30
9.8481
vs
Nifty 50 (80%) And Crisil Composite Bond Index (20%)
Note: returns over 1 year have been annualized
+0.20%
-0.20%
NAV
10.1436
2026-10-09
52 wk High
2026-01-02
11.2703
52 wk Low
2026-03-30
9.8481
vs
Nifty 50 (80%) And Crisil Composite Bond Index (20%)
Note: returns over 1 year have been annualized
+0.20%
-0.20%
ULIF07828/02/25Alpha300Fd101
NAV
10.2063
2026-10-09
52 wk High
2026-08-28
10.8613
52 wk Low
2026-03-31
8.4127
vs
Nifty Alpha 50
Note: returns over 1 year have been annualized
+0.20%
-0.20%
NAV
10.2063
2026-10-09
52 wk High
2026-08-28
10.8613
52 wk Low
2026-03-31
8.4127
vs
Nifty Alpha 50
Note: returns over 1 year have been annualized
+0.20%
-0.20%
NAV
10.2063
2026-10-09
52 wk High
2026-08-28
10.8613
52 wk Low
2026-03-31
8.4127
vs
Nifty Alpha 50
Note: returns over 1 year have been annualized
+0.20%
-0.20%
NAV
10.2063
2026-10-09
52 wk High
2026-08-28
10.8613
52 wk Low
2026-03-31
8.4127
vs
Nifty Alpha 50
Note: returns over 1 year have been annualized
+0.20%
-0.20%
ULIF08219/09/25TopMF500Fd101
NAV
9.1202
2026-10-09
52 wk High
2026-02-26
10.4429
52 wk Low
2026-10-08
9.0417
vs
NIFTY500 MULTIFACTOR MQVLV 50
Note: returns over 1 year have been annualized
+0.20%
-0.20%
NAV
9.1202
2026-10-09
52 wk High
2026-02-26
10.4429
52 wk Low
2026-10-08
9.0417
vs
NIFTY500 MULTIFACTOR MQVLV 50
Note: returns over 1 year have been annualized
+0.20%
-0.20%
NAV
9.1202
2026-10-09
52 wk High
2026-02-26
10.4429
52 wk Low
2026-10-08
9.0417
vs
NIFTY500 MULTIFACTOR MQVLV 50
Note: returns over 1 year have been annualized
+0.20%
-0.20%
NAV
9.1202
2026-10-09
52 wk High
2026-02-26
10.4429
52 wk Low
2026-10-08
9.0417
vs
NIFTY500 MULTIFACTOR MQVLV 50
Note: returns over 1 year have been annualized
+0.20%
-0.20%
ULIF08421/11/25InCnsmAdFd101
NAV
9.0086
2026-10-09
52 wk High
2025-12-22
10.0205
52 wk Low
2026-03-31
8.4557
vs
Nifty India Consumption
Note: returns over 1 year have been annualized
+0.20%
-0.20%
NAV
9.0086
2026-10-09
52 wk High
2025-12-22
10.0205
52 wk Low
2026-03-31
8.4557
vs
Nifty India Consumption
Note: returns over 1 year have been annualized
+0.20%
-0.20%
NAV
9.0086
2026-10-09
52 wk High
2025-12-22
10.0205
52 wk Low
2026-03-31
8.4557
vs
Nifty India Consumption
Note: returns over 1 year have been annualized
+0.20%
-0.20%
NAV
9.0086
2026-10-09
52 wk High
2025-12-22
10.0205
52 wk Low
2026-03-31
8.4557
vs
Nifty India Consumption
Note: returns over 1 year have been annualized
+0.20%
-0.20%
ULIF08602/03/26InSctrLrFd101
NAV
9.9997
2026-10-09
52 wk High
2026-08-03
11.0601
52 wk Low
2026-03-31
9.6626
vs
BSE India Sector Leaders ( Customised)
Note: returns over 1 year have been annualized
+0.20%
-0.20%
NAV
9.9997
2026-10-09
52 wk High
2026-08-03
11.0601
52 wk Low
2026-03-31
9.6626
vs
BSE India Sector Leaders ( Customised)
Note: returns over 1 year have been annualized
+0.20%
-0.20%
NAV
9.9997
2026-10-09
52 wk High
2026-08-03
11.0601
52 wk Low
2026-03-31
9.6626
vs
BSE India Sector Leaders ( Customised)
Note: returns over 1 year have been annualized
+0.20%
-0.20%
NAV
9.9997
2026-10-09
52 wk High
2026-08-03
11.0601
52 wk Low
2026-03-31
9.6626
vs
BSE India Sector Leaders ( Customised)
Note: returns over 1 year have been annualized
+0.20%
-0.20%
ULIF08801/06/26SmtVal50Fd101
NAV
9.1256
2026-10-09
52 wk High
2026-06-16
10
52 wk Low
2026-10-08
9.0319
vs
BSE 500 Enhanced Value 50 (Customised)
Note: returns over 1 year have been annualized
+0.20%
-0.20%
NAV
9.1256
2026-10-09
52 wk High
2026-06-16
10
52 wk Low
2026-10-08
9.0319
vs
BSE 500 Enhanced Value 50 (Customised)
Note: returns over 1 year have been annualized
+0.20%
-0.20%
NAV
9.1256
2026-10-09
52 wk High
2026-06-16
10
52 wk Low
2026-10-08
9.0319
vs
BSE 500 Enhanced Value 50 (Customised)
Note: returns over 1 year have been annualized
+0.20%
-0.20%
NAV
9.1256
2026-10-09
52 wk High
2026-06-16
10
52 wk Low
2026-10-08
9.0319
vs
BSE 500 Enhanced Value 50 (Customised)
Note: returns over 1 year have been annualized
+0.20%
-0.20%
ULIF09004/09/26DivLdrAdFd101
NAV
9.5073
2026-10-09
52 wk High
2026-09-23
10.031
52 wk Low
2026-10-08
9.3998
vs
BSE 500 Dividend Leaders 50 (Customised)
Note: returns over 1 year have been annualized
+0.20%
-0.20%
NAV
9.5073
2026-10-09
52 wk High
2026-09-23
10.031
52 wk Low
2026-10-08
9.3998
vs
BSE 500 Dividend Leaders 50 (Customised)
Note: returns over 1 year have been annualized
+0.20%
-0.20%
NAV
9.5073
2026-10-09
52 wk High
2026-09-23
10.031
52 wk Low
2026-10-08
9.3998
vs
BSE 500 Dividend Leaders 50 (Customised)
Note: returns over 1 year have been annualized
+0.20%
-0.20%
NAV
9.5073
2026-10-09
52 wk High
2026-09-23
10.031
52 wk Low
2026-10-08
9.3998
vs
BSE 500 Dividend Leaders 50 (Customised)
Note: returns over 1 year have been annualized
+0.20%
-0.20%
* Data as of 31st January 2026. Past Performance is not indicative of future performance of the fund.
NAV
29.4937
17.09.2020
52 week High
07.02.2020
52 week Low
23.03.2020
* Data as of 31st January 2026. Past Performance is not indicative of future performance of the fund.
* Data as of 31st January 2026. Past Performance is not indicative of future performance of the fund.
* Data as of 31st January 2026. Past Performance is not indicative of future performance of the fund.
ULIF03501/01/10BlueChipFd101
NAV
46.5947
2026-10-09
52 wk High
2026-01-02
54.1855
52 wk Low
2026-10-08
46.0289
vs
BSE100
Note: returns over 1 year have been annualized
+0.10%
-0.20%
NAV
46.5947
2026-10-09
52 wk High
2026-01-02
54.1855
52 wk Low
2026-10-08
46.0289
vs
BSE100
Note: returns over 1 year have been annualized
+0.10%
-0.20%
NAV
46.5947
2026-10-09
52 wk High
2026-01-02
54.1855
52 wk Low
2026-10-08
46.0289
vs
BSE100
Note: returns over 1 year have been annualized
+0.10%
-0.20%
NAV
46.5947
2026-10-09
52 wk High
2026-01-02
54.1855
52 wk Low
2026-10-08
46.0289
vs
BSE100
Note: returns over 1 year have been annualized
+0.10%
-0.20%
ULIF00102/01/04LiquidFund101
NAV
84.8221
2026-10-09
52 wk High
2026-10-09
84.8221
52 wk Low
2025-10-10
80.2803
vs
CRISIL Liquid Fund Index
Note: returns over 1 year have been annualized
+0.10%
-0.20%
NAV
84.8221
2026-10-09
52 wk High
2026-10-09
84.8221
52 wk Low
2025-10-10
80.2803
vs
CRISIL Liquid Fund Index
Note: returns over 1 year have been annualized
+0.10%
-0.20%
NAV
84.8221
2026-10-09
52 wk High
2026-10-09
84.8221
52 wk Low
2025-10-10
80.2803
vs
CRISIL Liquid Fund Index
Note: returns over 1 year have been annualized
+0.10%
-0.20%
NAV
84.8221
2026-10-09
52 wk High
2026-10-09
84.8221
52 wk Low
2025-10-10
80.2803
vs
CRISIL Liquid Fund Index
Note: returns over 1 year have been annualized
+0.10%
-0.20%
ULIF03601/01/10OpprtntyFd101
NAV
76.1007
2026-10-09
52 wk High
2026-08-31
82.876
52 wk Low
2026-03-31
69.1143
vs
Nifty Mid Cap 100
Note: returns over 1 year have been annualized
+0.10%
-0.20%
NAV
76.1007
2026-10-09
52 wk High
2026-08-31
82.876
52 wk Low
2026-03-31
69.1143
vs
Nifty Mid Cap 100
Note: returns over 1 year have been annualized
+0.10%
-0.20%
NAV
76.1007
2026-10-09
52 wk High
2026-08-31
82.876
52 wk Low
2026-03-31
69.1143
vs
Nifty Mid Cap 100
Note: returns over 1 year have been annualized
+0.10%
-0.20%
NAV
76.1007
2026-10-09
52 wk High
2026-08-31
82.876
52 wk Low
2026-03-31
69.1143
vs
Nifty Mid Cap 100
Note: returns over 1 year have been annualized
+0.10%
-0.20%
ULIF03901/09/10BalancedFd101
NAV
39.3021
2026-10-09
52 wk High
2026-01-02
41.5509
52 wk Low
2026-03-30
37.267
vs
60% BSE100 40% CRISIL Composite Bond Fund Index
Note: returns over 1 year have been annualized
+0.10%
-0.20%
NAV
39.3021
2026-10-09
52 wk High
2026-01-02
41.5509
52 wk Low
2026-03-30
37.267
vs
60% BSE100 40% CRISIL Composite Bond Fund Index
Note: returns over 1 year have been annualized
+0.10%
-0.20%
NAV
39.3021
2026-10-09
52 wk High
2026-01-02
41.5509
52 wk Low
2026-03-30
37.267
vs
60% BSE100 40% CRISIL Composite Bond Fund Index
Note: returns over 1 year have been annualized
+0.10%
-0.20%
NAV
39.3021
2026-10-09
52 wk High
2026-01-02
41.5509
52 wk Low
2026-03-30
37.267
vs
60% BSE100 40% CRISIL Composite Bond Fund Index
Note: returns over 1 year have been annualized
+0.10%
-0.20%
ULIF05501/08/13DivrEqtyFd101
NAV
38.2977
2026-10-09
52 wk High
2026-01-02
44.0461
52 wk Low
2026-03-31
37.5924
vs
BSE100
Note: returns over 1 year have been annualized
+0.10%
-0.20%
NAV
38.2977
2026-10-09
52 wk High
2026-01-02
44.0461
52 wk Low
2026-03-31
37.5924
vs
BSE100
Note: returns over 1 year have been annualized
+0.10%
-0.20%
NAV
38.2977
2026-10-09
52 wk High
2026-01-02
44.0461
52 wk Low
2026-03-31
37.5924
vs
BSE100
Note: returns over 1 year have been annualized
+0.10%
-0.20%
NAV
38.2977
2026-10-09
52 wk High
2026-01-02
44.0461
52 wk Low
2026-03-31
37.5924
vs
BSE100
Note: returns over 1 year have been annualized
+0.10%
-0.20%
ULIF05601/08/13Bond Funds101
NAV
21.6938
2026-10-09
52 wk High
2026-08-14
21.9854
52 wk Low
2026-04-02
21.1566
vs
CRISIL Composite Bond Fund Index
Note: returns over 1 year have been annualized
+0.10%
-0.20%
NAV
21.6938
2026-10-09
52 wk High
2026-08-14
21.9854
52 wk Low
2026-04-02
21.1566
vs
CRISIL Composite Bond Fund Index
Note: returns over 1 year have been annualized
+0.10%
-0.20%
NAV
21.6938
2026-10-09
52 wk High
2026-08-14
21.9854
52 wk Low
2026-04-02
21.1566
vs
CRISIL Composite Bond Fund Index
Note: returns over 1 year have been annualized
+0.10%
-0.20%
NAV
21.6938
2026-10-09
52 wk High
2026-08-14
21.9854
52 wk Low
2026-04-02
21.1566
vs
CRISIL Composite Bond Fund Index
Note: returns over 1 year have been annualized
+0.10%
-0.20%
ULIF06618/01/18DiscvryFnd101
NAV
42.2232
2026-10-09
52 wk High
2026-08-31
45.6887
52 wk Low
2026-03-31
38.1568
vs
Nifty Mid Cap 100
Note: returns over 1 year have been annualized
+0.10%
-0.20%
NAV
42.2232
2026-10-09
52 wk High
2026-08-31
45.6887
52 wk Low
2026-03-31
38.1568
vs
Nifty Mid Cap 100
Note: returns over 1 year have been annualized
+0.10%
-0.20%
NAV
42.2232
2026-10-09
52 wk High
2026-08-31
45.6887
52 wk Low
2026-03-31
38.1568
vs
Nifty Mid Cap 100
Note: returns over 1 year have been annualized
+0.10%
-0.20%
NAV
42.2232
2026-10-09
52 wk High
2026-08-31
45.6887
52 wk Low
2026-03-31
38.1568
vs
Nifty Mid Cap 100
Note: returns over 1 year have been annualized
+0.10%
-0.20%
ULIF06723/03/18EqtyAdvtFd101
NAV
26.2062
2026-10-09
52 wk High
2026-01-02
29.6914
52 wk Low
2026-03-31
25.3814
vs
BSE200
Note: returns over 1 year have been annualized
+0.10%
-0.20%
NAV
26.2062
2026-10-09
52 wk High
2026-01-02
29.6914
52 wk Low
2026-03-31
25.3814
vs
BSE200
Note: returns over 1 year have been annualized
+0.10%
-0.20%
NAV
26.2062
2026-10-09
52 wk High
2026-01-02
29.6914
52 wk Low
2026-03-31
25.3814
vs
BSE200
Note: returns over 1 year have been annualized
+0.10%
-0.20%
NAV
26.2062
2026-10-09
52 wk High
2026-01-02
29.6914
52 wk Low
2026-03-31
25.3814
vs
BSE200
Note: returns over 1 year have been annualized
+0.10%
-0.20%
ULIF06814/06/19BondPlusFd101
NAV
15.28
2026-10-09
52 wk High
2026-08-14
15.384
52 wk Low
2026-04-02
14.8406
vs
CRISIL Composite Bond Fund Index
Note: returns over 1 year have been annualized
+0.10%
-0.20%
NAV
15.28
2026-10-09
52 wk High
2026-08-14
15.384
52 wk Low
2026-04-02
14.8406
vs
CRISIL Composite Bond Fund Index
Note: returns over 1 year have been annualized
+0.10%
-0.20%
NAV
15.28
2026-10-09
52 wk High
2026-08-14
15.384
52 wk Low
2026-04-02
14.8406
vs
CRISIL Composite Bond Fund Index
Note: returns over 1 year have been annualized
+0.10%
-0.20%
NAV
15.28
2026-10-09
52 wk High
2026-08-14
15.384
52 wk Low
2026-04-02
14.8406
vs
CRISIL Composite Bond Fund Index
Note: returns over 1 year have been annualized
+0.10%
-0.20%
ULIF06914/06/19SecAdvFund101
NAV
15.0753
2026-10-09
52 wk High
2026-08-14
15.2588
52 wk Low
2026-04-02
14.6424
vs
CRISIL Composite Bond Fund Index
Note: returns over 1 year have been annualized
+0.10%
-0.20%
NAV
15.0753
2026-10-09
52 wk High
2026-08-14
15.2588
52 wk Low
2026-04-02
14.6424
vs
CRISIL Composite Bond Fund Index
Note: returns over 1 year have been annualized
+0.10%
-0.20%
NAV
15.0753
2026-10-09
52 wk High
2026-08-14
15.2588
52 wk Low
2026-04-02
14.6424
vs
CRISIL Composite Bond Fund Index
Note: returns over 1 year have been annualized
+0.10%
-0.20%
NAV
15.0753
2026-10-09
52 wk High
2026-08-14
15.2588
52 wk Low
2026-04-02
14.6424
vs
CRISIL Composite Bond Fund Index
Note: returns over 1 year have been annualized
+0.10%
-0.20%
ULIF07019/07/21SustnblEqF101
NAV
13.5786
2026-10-09
52 wk High
2026-01-02
15.1515
52 wk Low
2026-03-31
12.8907
vs
Nifty 100 ESG
Note: returns over 1 year have been annualized
+0.10%
-0.20%
NAV
13.5786
2026-10-09
52 wk High
2026-01-02
15.1515
52 wk Low
2026-03-31
12.8907
vs
Nifty 100 ESG
Note: returns over 1 year have been annualized
+0.10%
-0.20%
NAV
13.5786
2026-10-09
52 wk High
2026-01-02
15.1515
52 wk Low
2026-03-31
12.8907
vs
Nifty 100 ESG
Note: returns over 1 year have been annualized
+0.10%
-0.20%
NAV
13.5786
2026-10-09
52 wk High
2026-01-02
15.1515
52 wk Low
2026-03-31
12.8907
vs
Nifty 100 ESG
Note: returns over 1 year have been annualized
+0.10%
-0.20%
ULIF07114/07/23FlexiCapFd101
NAV
14.4033
2026-10-09
52 wk High
2026-01-02
15.9756
52 wk Low
2026-03-31
13.7661
vs
NSE Nifty 500 (100%)
Note: returns over 1 year have been annualized
+0.10%
-0.20%
NAV
14.4033
2026-10-09
52 wk High
2026-01-02
15.9756
52 wk Low
2026-03-31
13.7661
vs
NSE Nifty 500 (100%)
Note: returns over 1 year have been annualized
+0.10%
-0.20%
NAV
14.4033
2026-10-09
52 wk High
2026-01-02
15.9756
52 wk Low
2026-03-31
13.7661
vs
NSE Nifty 500 (100%)
Note: returns over 1 year have been annualized
+0.10%
-0.20%
NAV
14.4033
2026-10-09
52 wk High
2026-01-02
15.9756
52 wk Low
2026-03-31
13.7661
vs
NSE Nifty 500 (100%)
Note: returns over 1 year have been annualized
+0.10%
-0.20%
ULIF07317/01/24MidCpMoIdx101
NAV
10.5625
2026-10-09
52 wk High
2026-08-31
11.3639
52 wk Low
2026-03-23
9.6684
vs
NIFTY MIDCAP150 MOMENTUM 50 (100%)
Note: returns over 1 year have been annualized
+0.10%
-0.20%
NAV
10.5625
2026-10-09
52 wk High
2026-08-31
11.3639
52 wk Low
2026-03-23
9.6684
vs
NIFTY MIDCAP150 MOMENTUM 50 (100%)
Note: returns over 1 year have been annualized
+0.10%
-0.20%
NAV
10.5625
2026-10-09
52 wk High
2026-08-31
11.3639
52 wk Low
2026-03-23
9.6684
vs
NIFTY MIDCAP150 MOMENTUM 50 (100%)
Note: returns over 1 year have been annualized
+0.10%
-0.20%
NAV
10.5625
2026-10-09
52 wk High
2026-08-31
11.3639
52 wk Low
2026-03-23
9.6684
vs
NIFTY MIDCAP150 MOMENTUM 50 (100%)
Note: returns over 1 year have been annualized
+0.10%
-0.20%
ULIF07528/05/24AlphaIdxFd101
NAV
8.5289
2026-10-09
52 wk High
2026-08-27
9.3362
52 wk Low
2026-03-31
7.5283
vs
NIFTY200 ALPHA 30
Note: returns over 1 year have been annualized
+0.10%
-0.20%
NAV
8.5289
2026-10-09
52 wk High
2026-08-27
9.3362
52 wk Low
2026-03-31
7.5283
vs
NIFTY200 ALPHA 30
Note: returns over 1 year have been annualized
+0.10%
-0.20%
NAV
8.5289
2026-10-09
52 wk High
2026-08-27
9.3362
52 wk Low
2026-03-31
7.5283
vs
NIFTY200 ALPHA 30
Note: returns over 1 year have been annualized
+0.10%
-0.20%
NAV
8.5289
2026-10-09
52 wk High
2026-08-27
9.3362
52 wk Low
2026-03-31
7.5283
vs
NIFTY200 ALPHA 30
Note: returns over 1 year have been annualized
+0.10%
-0.20%
ULIF07616/10/24Top500MoFd101
NAV
8.534
2026-10-09
52 wk High
2025-11-20
9.1631
52 wk Low
2026-03-31
7.573
vs
NIFTY500 MOMENTUM 50
Note: returns over 1 year have been annualized
+0.10%
-0.20%
NAV
8.534
2026-10-09
52 wk High
2025-11-20
9.1631
52 wk Low
2026-03-31
7.573
vs
NIFTY500 MOMENTUM 50
Note: returns over 1 year have been annualized
+0.10%
-0.20%
NAV
8.534
2026-10-09
52 wk High
2025-11-20
9.1631
52 wk Low
2026-03-31
7.573
vs
NIFTY500 MOMENTUM 50
Note: returns over 1 year have been annualized
+0.10%
-0.20%
NAV
8.534
2026-10-09
52 wk High
2025-11-20
9.1631
52 wk Low
2026-03-31
7.573
vs
NIFTY500 MOMENTUM 50
Note: returns over 1 year have been annualized
+0.10%
-0.20%
ULIF08028/02/25DynamicFnd101
NAV
10.1436
2026-10-09
52 wk High
2026-01-02
11.2703
52 wk Low
2026-03-30
9.8481
vs
Nifty 50 (80%) And Crisil Composite Bond Index (20%)
Note: returns over 1 year have been annualized
+0.10%
-0.20%
NAV
10.1436
2026-10-09
52 wk High
2026-01-02
11.2703
52 wk Low
2026-03-30
9.8481
vs
Nifty 50 (80%) And Crisil Composite Bond Index (20%)
Note: returns over 1 year have been annualized
+0.10%
-0.20%
NAV
10.1436
2026-10-09
52 wk High
2026-01-02
11.2703
52 wk Low
2026-03-30
9.8481
vs
Nifty 50 (80%) And Crisil Composite Bond Index (20%)
Note: returns over 1 year have been annualized
+0.10%
-0.20%
NAV
10.1436
2026-10-09
52 wk High
2026-01-02
11.2703
52 wk Low
2026-03-30
9.8481
vs
Nifty 50 (80%) And Crisil Composite Bond Index (20%)
Note: returns over 1 year have been annualized
+0.10%
-0.20%
ULIF07828/02/25Alpha300Fd101
NAV
10.2063
2026-10-09
52 wk High
2026-08-28
10.8613
52 wk Low
2026-03-31
8.4127
vs
Nifty Alpha 50
Note: returns over 1 year have been annualized
+0.10%
-0.20%
NAV
10.2063
2026-10-09
52 wk High
2026-08-28
10.8613
52 wk Low
2026-03-31
8.4127
vs
Nifty Alpha 50
Note: returns over 1 year have been annualized
+0.10%
-0.20%
NAV
10.2063
2026-10-09
52 wk High
2026-08-28
10.8613
52 wk Low
2026-03-31
8.4127
vs
Nifty Alpha 50
Note: returns over 1 year have been annualized
+0.10%
-0.20%
NAV
10.2063
2026-10-09
52 wk High
2026-08-28
10.8613
52 wk Low
2026-03-31
8.4127
vs
Nifty Alpha 50
Note: returns over 1 year have been annualized
+0.10%
-0.20%
ULIF08219/09/25TopMF500Fd101
NAV
9.1202
2026-10-09
52 wk High
2026-02-26
10.4429
52 wk Low
2026-10-08
9.0417
vs
NIFTY500 MULTIFACTOR MQVLV 50
Note: returns over 1 year have been annualized
+0.10%
-0.20%
NAV
9.1202
2026-10-09
52 wk High
2026-02-26
10.4429
52 wk Low
2026-10-08
9.0417
vs
NIFTY500 MULTIFACTOR MQVLV 50
Note: returns over 1 year have been annualized
+0.10%
-0.20%
NAV
9.1202
2026-10-09
52 wk High
2026-02-26
10.4429
52 wk Low
2026-10-08
9.0417
vs
NIFTY500 MULTIFACTOR MQVLV 50
Note: returns over 1 year have been annualized
+0.10%
-0.20%
NAV
9.1202
2026-10-09
52 wk High
2026-02-26
10.4429
52 wk Low
2026-10-08
9.0417
vs
NIFTY500 MULTIFACTOR MQVLV 50
Note: returns over 1 year have been annualized
+0.10%
-0.20%
ULIF08421/11/25InCnsmAdFd101
NAV
9.0086
2026-10-09
52 wk High
2025-12-22
10.0205
52 wk Low
2026-03-31
8.4557
vs
Nifty India Consumption
Note: returns over 1 year have been annualized
+0.10%
-0.20%
NAV
9.0086
2026-10-09
52 wk High
2025-12-22
10.0205
52 wk Low
2026-03-31
8.4557
vs
Nifty India Consumption
Note: returns over 1 year have been annualized
+0.10%
-0.20%
NAV
9.0086
2026-10-09
52 wk High
2025-12-22
10.0205
52 wk Low
2026-03-31
8.4557
vs
Nifty India Consumption
Note: returns over 1 year have been annualized
+0.10%
-0.20%
NAV
9.0086
2026-10-09
52 wk High
2025-12-22
10.0205
52 wk Low
2026-03-31
8.4557
vs
Nifty India Consumption
Note: returns over 1 year have been annualized
+0.10%
-0.20%
ULIF08602/03/26InSctrLrFd101
NAV
9.9997
2026-10-09
52 wk High
2026-08-03
11.0601
52 wk Low
2026-03-31
9.6626
vs
BSE India Sector Leaders ( Customised)
Note: returns over 1 year have been annualized
+0.10%
-0.20%
NAV
9.9997
2026-10-09
52 wk High
2026-08-03
11.0601
52 wk Low
2026-03-31
9.6626
vs
BSE India Sector Leaders ( Customised)
Note: returns over 1 year have been annualized
+0.10%
-0.20%
NAV
9.9997
2026-10-09
52 wk High
2026-08-03
11.0601
52 wk Low
2026-03-31
9.6626
vs
BSE India Sector Leaders ( Customised)
Note: returns over 1 year have been annualized
+0.10%
-0.20%
NAV
9.9997
2026-10-09
52 wk High
2026-08-03
11.0601
52 wk Low
2026-03-31
9.6626
vs
BSE India Sector Leaders ( Customised)
Note: returns over 1 year have been annualized
+0.10%
-0.20%
ULIF08801/06/26SmtVal50Fd101
NAV
9.1256
2026-10-09
52 wk High
2026-06-16
10
52 wk Low
2026-10-08
9.0319
vs
BSE 500 Enhanced Value 50 (Customised)
Note: returns over 1 year have been annualized
+0.10%
-0.20%
NAV
9.1256
2026-10-09
52 wk High
2026-06-16
10
52 wk Low
2026-10-08
9.0319
vs
BSE 500 Enhanced Value 50 (Customised)
Note: returns over 1 year have been annualized
+0.10%
-0.20%
NAV
9.1256
2026-10-09
52 wk High
2026-06-16
10
52 wk Low
2026-10-08
9.0319
vs
BSE 500 Enhanced Value 50 (Customised)
Note: returns over 1 year have been annualized
+0.10%
-0.20%
NAV
9.1256
2026-10-09
52 wk High
2026-06-16
10
52 wk Low
2026-10-08
9.0319
vs
BSE 500 Enhanced Value 50 (Customised)
Note: returns over 1 year have been annualized
+0.10%
-0.20%
ULIF09004/09/26DivLdrAdFd101
NAV
9.5073
2026-10-09
52 wk High
2026-09-23
10.031
52 wk Low
2026-10-08
9.3998
vs
BSE 500 Dividend Leaders 50 (Customised)
Note: returns over 1 year have been annualized
+0.10%
-0.20%
NAV
9.5073
2026-10-09
52 wk High
2026-09-23
10.031
52 wk Low
2026-10-08
9.3998
vs
BSE 500 Dividend Leaders 50 (Customised)
Note: returns over 1 year have been annualized
+0.10%
-0.20%
NAV
9.5073
2026-10-09
52 wk High
2026-09-23
10.031
52 wk Low
2026-10-08
9.3998
vs
BSE 500 Dividend Leaders 50 (Customised)
Note: returns over 1 year have been annualized
+0.10%
-0.20%
NAV
9.5073
2026-10-09
52 wk High
2026-09-23
10.031
52 wk Low
2026-10-08
9.3998
vs
BSE 500 Dividend Leaders 50 (Customised)
Note: returns over 1 year have been annualized
+0.10%
-0.20%
ULIF03501/01/10BlueChipFd101
NAV
46.5947
2026-10-09
52 wk High
2026-01-02
54.1855
52 wk Low
2026-10-08
46.0289
vs
BSE100
Note: returns over 1 year have been annualized
+0.10%
-0.20%
NAV
46.5947
2026-10-09
52 wk High
2026-01-02
54.1855
52 wk Low
2026-10-08
46.0289
vs
BSE100
Note: returns over 1 year have been annualized
+0.10%
-0.20%
NAV
46.5947
2026-10-09
52 wk High
2026-01-02
54.1855
52 wk Low
2026-10-08
46.0289
vs
BSE100
Note: returns over 1 year have been annualized
+0.10%
-0.20%
NAV
46.5947
2026-10-09
52 wk High
2026-01-02
54.1855
52 wk Low
2026-10-08
46.0289
vs
BSE100
Note: returns over 1 year have been annualized
+0.10%
-0.20%
ULIF03601/01/10OpprtntyFd101
NAV
76.1007
2026-10-09
52 wk High
2026-08-31
82.876
52 wk Low
2026-03-31
69.1143
vs
Nifty Mid Cap 100
Note: returns over 1 year have been annualized
+0.10%
-0.20%
NAV
76.1007
2026-10-09
52 wk High
2026-08-31
82.876
52 wk Low
2026-03-31
69.1143
vs
Nifty Mid Cap 100
Note: returns over 1 year have been annualized
+0.10%
-0.20%
NAV
76.1007
2026-10-09
52 wk High
2026-08-31
82.876
52 wk Low
2026-03-31
69.1143
vs
Nifty Mid Cap 100
Note: returns over 1 year have been annualized
+0.10%
-0.20%
NAV
76.1007
2026-10-09
52 wk High
2026-08-31
82.876
52 wk Low
2026-03-31
69.1143
vs
Nifty Mid Cap 100
Note: returns over 1 year have been annualized
+0.10%
-0.20%
ULIF05501/08/13DivrEqtyFd101
NAV
38.2977
2026-10-09
52 wk High
2026-01-02
44.0461
52 wk Low
2026-03-31
37.5924
vs
BSE100
Note: returns over 1 year have been annualized
+0.10%
-0.20%
NAV
38.2977
2026-10-09
52 wk High
2026-01-02
44.0461
52 wk Low
2026-03-31
37.5924
vs
BSE100
Note: returns over 1 year have been annualized
+0.10%
-0.20%
NAV
38.2977
2026-10-09
52 wk High
2026-01-02
44.0461
52 wk Low
2026-03-31
37.5924
vs
BSE100
Note: returns over 1 year have been annualized
+0.10%
-0.20%
NAV
38.2977
2026-10-09
52 wk High
2026-01-02
44.0461
52 wk Low
2026-03-31
37.5924
vs
BSE100
Note: returns over 1 year have been annualized
+0.10%
-0.20%
ULIF06618/01/18DiscvryFnd101
NAV
42.2232
2026-10-09
52 wk High
2026-08-31
45.6887
52 wk Low
2026-03-31
38.1568
vs
Nifty Mid Cap 100
Note: returns over 1 year have been annualized
+0.10%
-0.20%
NAV
42.2232
2026-10-09
52 wk High
2026-08-31
45.6887
52 wk Low
2026-03-31
38.1568
vs
Nifty Mid Cap 100
Note: returns over 1 year have been annualized
+0.10%
-0.20%
NAV
42.2232
2026-10-09
52 wk High
2026-08-31
45.6887
52 wk Low
2026-03-31
38.1568
vs
Nifty Mid Cap 100
Note: returns over 1 year have been annualized
+0.10%
-0.20%
NAV
42.2232
2026-10-09
52 wk High
2026-08-31
45.6887
52 wk Low
2026-03-31
38.1568
vs
Nifty Mid Cap 100
Note: returns over 1 year have been annualized
+0.10%
-0.20%
ULIF06723/03/18EqtyAdvtFd101
NAV
26.2062
2026-10-09
52 wk High
2026-01-02
29.6914
52 wk Low
2026-03-31
25.3814
vs
BSE200
Note: returns over 1 year have been annualized
+0.10%
-0.20%
NAV
26.2062
2026-10-09
52 wk High
2026-01-02
29.6914
52 wk Low
2026-03-31
25.3814
vs
BSE200
Note: returns over 1 year have been annualized
+0.10%
-0.20%
NAV
26.2062
2026-10-09
52 wk High
2026-01-02
29.6914
52 wk Low
2026-03-31
25.3814
vs
BSE200
Note: returns over 1 year have been annualized
+0.10%
-0.20%
NAV
26.2062
2026-10-09
52 wk High
2026-01-02
29.6914
52 wk Low
2026-03-31
25.3814
vs
BSE200
Note: returns over 1 year have been annualized
+0.10%
-0.20%
ULIF07019/07/21SustnblEqF101
NAV
13.5786
2026-10-09
52 wk High
2026-01-02
15.1515
52 wk Low
2026-03-31
12.8907
vs
Nifty 100 ESG
Note: returns over 1 year have been annualized
+0.10%
-0.20%
NAV
13.5786
2026-10-09
52 wk High
2026-01-02
15.1515
52 wk Low
2026-03-31
12.8907
vs
Nifty 100 ESG
Note: returns over 1 year have been annualized
+0.10%
-0.20%
NAV
13.5786
2026-10-09
52 wk High
2026-01-02
15.1515
52 wk Low
2026-03-31
12.8907
vs
Nifty 100 ESG
Note: returns over 1 year have been annualized
+0.10%
-0.20%
NAV
13.5786
2026-10-09
52 wk High
2026-01-02
15.1515
52 wk Low
2026-03-31
12.8907
vs
Nifty 100 ESG
Note: returns over 1 year have been annualized
+0.10%
-0.20%
ULIF07114/07/23FlexiCapFd101
NAV
14.4033
2026-10-09
52 wk High
2026-01-02
15.9756
52 wk Low
2026-03-31
13.7661
vs
NSE Nifty 500 (100%)
Note: returns over 1 year have been annualized
+0.10%
-0.20%
NAV
14.4033
2026-10-09
52 wk High
2026-01-02
15.9756
52 wk Low
2026-03-31
13.7661
vs
NSE Nifty 500 (100%)
Note: returns over 1 year have been annualized
+0.10%
-0.20%
NAV
14.4033
2026-10-09
52 wk High
2026-01-02
15.9756
52 wk Low
2026-03-31
13.7661
vs
NSE Nifty 500 (100%)
Note: returns over 1 year have been annualized
+0.10%
-0.20%
NAV
14.4033
2026-10-09
52 wk High
2026-01-02
15.9756
52 wk Low
2026-03-31
13.7661
vs
NSE Nifty 500 (100%)
Note: returns over 1 year have been annualized
+0.10%
-0.20%
ULIF07317/01/24MidCpMoIdx101
NAV
10.5625
2026-10-09
52 wk High
2026-08-31
11.3639
52 wk Low
2026-03-23
9.6684
vs
NIFTY MIDCAP150 MOMENTUM 50 (100%)
Note: returns over 1 year have been annualized
+0.10%
-0.20%
NAV
10.5625
2026-10-09
52 wk High
2026-08-31
11.3639
52 wk Low
2026-03-23
9.6684
vs
NIFTY MIDCAP150 MOMENTUM 50 (100%)
Note: returns over 1 year have been annualized
+0.10%
-0.20%
NAV
10.5625
2026-10-09
52 wk High
2026-08-31
11.3639
52 wk Low
2026-03-23
9.6684
vs
NIFTY MIDCAP150 MOMENTUM 50 (100%)
Note: returns over 1 year have been annualized
+0.10%
-0.20%
NAV
10.5625
2026-10-09
52 wk High
2026-08-31
11.3639
52 wk Low
2026-03-23
9.6684
vs
NIFTY MIDCAP150 MOMENTUM 50 (100%)
Note: returns over 1 year have been annualized
+0.10%
-0.20%
ULIF07528/05/24AlphaIdxFd101
NAV
8.5289
2026-10-09
52 wk High
2026-08-27
9.3362
52 wk Low
2026-03-31
7.5283
vs
NIFTY200 ALPHA 30
Note: returns over 1 year have been annualized
+0.10%
-0.20%
NAV
8.5289
2026-10-09
52 wk High
2026-08-27
9.3362
52 wk Low
2026-03-31
7.5283
vs
NIFTY200 ALPHA 30
Note: returns over 1 year have been annualized
+0.10%
-0.20%
NAV
8.5289
2026-10-09
52 wk High
2026-08-27
9.3362
52 wk Low
2026-03-31
7.5283
vs
NIFTY200 ALPHA 30
Note: returns over 1 year have been annualized
+0.10%
-0.20%
NAV
8.5289
2026-10-09
52 wk High
2026-08-27
9.3362
52 wk Low
2026-03-31
7.5283
vs
NIFTY200 ALPHA 30
Note: returns over 1 year have been annualized
+0.10%
-0.20%
ULIF07616/10/24Top500MoFd101
NAV
8.534
2026-10-09
52 wk High
2025-11-20
9.1631
52 wk Low
2026-03-31
7.573
vs
NIFTY500 MOMENTUM 50
Note: returns over 1 year have been annualized
+0.10%
-0.20%
NAV
8.534
2026-10-09
52 wk High
2025-11-20
9.1631
52 wk Low
2026-03-31
7.573
vs
NIFTY500 MOMENTUM 50
Note: returns over 1 year have been annualized
+0.10%
-0.20%
NAV
8.534
2026-10-09
52 wk High
2025-11-20
9.1631
52 wk Low
2026-03-31
7.573
vs
NIFTY500 MOMENTUM 50
Note: returns over 1 year have been annualized
+0.10%
-0.20%
NAV
8.534
2026-10-09
52 wk High
2025-11-20
9.1631
52 wk Low
2026-03-31
7.573
vs
NIFTY500 MOMENTUM 50
Note: returns over 1 year have been annualized
+0.10%
-0.20%
ULIF07828/02/25Alpha300Fd101
NAV
10.2063
2026-10-09
52 wk High
2026-08-28
10.8613
52 wk Low
2026-03-31
8.4127
vs
Nifty Alpha 50
Note: returns over 1 year have been annualized
+0.10%
-0.20%
NAV
10.2063
2026-10-09
52 wk High
2026-08-28
10.8613
52 wk Low
2026-03-31
8.4127
vs
Nifty Alpha 50
Note: returns over 1 year have been annualized
+0.10%
-0.20%
NAV
10.2063
2026-10-09
52 wk High
2026-08-28
10.8613
52 wk Low
2026-03-31
8.4127
vs
Nifty Alpha 50
Note: returns over 1 year have been annualized
+0.10%
-0.20%
NAV
10.2063
2026-10-09
52 wk High
2026-08-28
10.8613
52 wk Low
2026-03-31
8.4127
vs
Nifty Alpha 50
Note: returns over 1 year have been annualized
+0.10%
-0.20%
ULIF08219/09/25TopMF500Fd101
NAV
9.1202
2026-10-09
52 wk High
2026-02-26
10.4429
52 wk Low
2026-10-08
9.0417
vs
NIFTY500 MULTIFACTOR MQVLV 50
Note: returns over 1 year have been annualized
+0.10%
-0.20%
NAV
9.1202
2026-10-09
52 wk High
2026-02-26
10.4429
52 wk Low
2026-10-08
9.0417
vs
NIFTY500 MULTIFACTOR MQVLV 50
Note: returns over 1 year have been annualized
+0.10%
-0.20%
NAV
9.1202
2026-10-09
52 wk High
2026-02-26
10.4429
52 wk Low
2026-10-08
9.0417
vs
NIFTY500 MULTIFACTOR MQVLV 50
Note: returns over 1 year have been annualized
+0.10%
-0.20%
NAV
9.1202
2026-10-09
52 wk High
2026-02-26
10.4429
52 wk Low
2026-10-08
9.0417
vs
NIFTY500 MULTIFACTOR MQVLV 50
Note: returns over 1 year have been annualized
+0.10%
-0.20%
ULIF08421/11/25InCnsmAdFd101
NAV
9.0086
2026-10-09
52 wk High
2025-12-22
10.0205
52 wk Low
2026-03-31
8.4557
vs
Nifty India Consumption
Note: returns over 1 year have been annualized
+0.10%
-0.20%
NAV
9.0086
2026-10-09
52 wk High
2025-12-22
10.0205
52 wk Low
2026-03-31
8.4557
vs
Nifty India Consumption
Note: returns over 1 year have been annualized
+0.10%
-0.20%
NAV
9.0086
2026-10-09
52 wk High
2025-12-22
10.0205
52 wk Low
2026-03-31
8.4557
vs
Nifty India Consumption
Note: returns over 1 year have been annualized
+0.10%
-0.20%
NAV
9.0086
2026-10-09
52 wk High
2025-12-22
10.0205
52 wk Low
2026-03-31
8.4557
vs
Nifty India Consumption
Note: returns over 1 year have been annualized
+0.10%
-0.20%
ULIF08602/03/26InSctrLrFd101
NAV
9.9997
2026-10-09
52 wk High
2026-08-03
11.0601
52 wk Low
2026-03-31
9.6626
vs
BSE India Sector Leaders ( Customised)
Note: returns over 1 year have been annualized
+0.10%
-0.20%
NAV
9.9997
2026-10-09
52 wk High
2026-08-03
11.0601
52 wk Low
2026-03-31
9.6626
vs
BSE India Sector Leaders ( Customised)
Note: returns over 1 year have been annualized
+0.10%
-0.20%
NAV
9.9997
2026-10-09
52 wk High
2026-08-03
11.0601
52 wk Low
2026-03-31
9.6626
vs
BSE India Sector Leaders ( Customised)
Note: returns over 1 year have been annualized
+0.10%
-0.20%
NAV
9.9997
2026-10-09
52 wk High
2026-08-03
11.0601
52 wk Low
2026-03-31
9.6626
vs
BSE India Sector Leaders ( Customised)
Note: returns over 1 year have been annualized
+0.10%
-0.20%
ULIF08801/06/26SmtVal50Fd101
NAV
9.1256
2026-10-09
52 wk High
2026-06-16
10
52 wk Low
2026-10-08
9.0319
vs
BSE 500 Enhanced Value 50 (Customised)
Note: returns over 1 year have been annualized
+0.10%
-0.20%
NAV
9.1256
2026-10-09
52 wk High
2026-06-16
10
52 wk Low
2026-10-08
9.0319
vs
BSE 500 Enhanced Value 50 (Customised)
Note: returns over 1 year have been annualized
+0.10%
-0.20%
NAV
9.1256
2026-10-09
52 wk High
2026-06-16
10
52 wk Low
2026-10-08
9.0319
vs
BSE 500 Enhanced Value 50 (Customised)
Note: returns over 1 year have been annualized
+0.10%
-0.20%
NAV
9.1256
2026-10-09
52 wk High
2026-06-16
10
52 wk Low
2026-10-08
9.0319
vs
BSE 500 Enhanced Value 50 (Customised)
Note: returns over 1 year have been annualized
+0.10%
-0.20%
ULIF09004/09/26DivLdrAdFd101
NAV
9.5073
2026-10-09
52 wk High
2026-09-23
10.031
52 wk Low
2026-10-08
9.3998
vs
BSE 500 Dividend Leaders 50 (Customised)
Note: returns over 1 year have been annualized
+0.10%
-0.20%
NAV
9.5073
2026-10-09
52 wk High
2026-09-23
10.031
52 wk Low
2026-10-08
9.3998
vs
BSE 500 Dividend Leaders 50 (Customised)
Note: returns over 1 year have been annualized
+0.10%
-0.20%
NAV
9.5073
2026-10-09
52 wk High
2026-09-23
10.031
52 wk Low
2026-10-08
9.3998
vs
BSE 500 Dividend Leaders 50 (Customised)
Note: returns over 1 year have been annualized
+0.10%
-0.20%
NAV
9.5073
2026-10-09
52 wk High
2026-09-23
10.031
52 wk Low
2026-10-08
9.3998
vs
BSE 500 Dividend Leaders 50 (Customised)
Note: returns over 1 year have been annualized
+0.10%
-0.20%
ULIF00102/01/04LiquidFund101
NAV
84.8221
2026-10-09
52 wk High
2026-10-09
84.8221
52 wk Low
2025-10-10
80.2803
vs
CRISIL Liquid Fund Index
Note: returns over 1 year have been annualized
+0.10%
-0.20%
NAV
84.8221
2026-10-09
52 wk High
2026-10-09
84.8221
52 wk Low
2025-10-10
80.2803
vs
CRISIL Liquid Fund Index
Note: returns over 1 year have been annualized
+0.10%
-0.20%
NAV
84.8221
2026-10-09
52 wk High
2026-10-09
84.8221
52 wk Low
2025-10-10
80.2803
vs
CRISIL Liquid Fund Index
Note: returns over 1 year have been annualized
+0.10%
-0.20%
NAV
84.8221
2026-10-09
52 wk High
2026-10-09
84.8221
52 wk Low
2025-10-10
80.2803
vs
CRISIL Liquid Fund Index
Note: returns over 1 year have been annualized
+0.10%
-0.20%
ULIF05601/08/13Bond Funds101
NAV
21.6938
2026-10-09
52 wk High
2026-08-14
21.9854
52 wk Low
2026-04-02
21.1566
vs
CRISIL Composite Bond Fund Index
Note: returns over 1 year have been annualized
+0.10%
-0.20%
NAV
21.6938
2026-10-09
52 wk High
2026-08-14
21.9854
52 wk Low
2026-04-02
21.1566
vs
CRISIL Composite Bond Fund Index
Note: returns over 1 year have been annualized
+0.10%
-0.20%
NAV
21.6938
2026-10-09
52 wk High
2026-08-14
21.9854
52 wk Low
2026-04-02
21.1566
vs
CRISIL Composite Bond Fund Index
Note: returns over 1 year have been annualized
+0.10%
-0.20%
NAV
21.6938
2026-10-09
52 wk High
2026-08-14
21.9854
52 wk Low
2026-04-02
21.1566
vs
CRISIL Composite Bond Fund Index
Note: returns over 1 year have been annualized
+0.10%
-0.20%
ULIF06814/06/19BondPlusFd101
NAV
15.28
2026-10-09
52 wk High
2026-08-14
15.384
52 wk Low
2026-04-02
14.8406
vs
CRISIL Composite Bond Fund Index
Note: returns over 1 year have been annualized
+0.10%
-0.20%
NAV
15.28
2026-10-09
52 wk High
2026-08-14
15.384
52 wk Low
2026-04-02
14.8406
vs
CRISIL Composite Bond Fund Index
Note: returns over 1 year have been annualized
+0.10%
-0.20%
NAV
15.28
2026-10-09
52 wk High
2026-08-14
15.384
52 wk Low
2026-04-02
14.8406
vs
CRISIL Composite Bond Fund Index
Note: returns over 1 year have been annualized
+0.10%
-0.20%
NAV
15.28
2026-10-09
52 wk High
2026-08-14
15.384
52 wk Low
2026-04-02
14.8406
vs
CRISIL Composite Bond Fund Index
Note: returns over 1 year have been annualized
+0.10%
-0.20%
ULIF03901/09/10BalancedFd101
NAV
39.3021
2026-10-09
52 wk High
2026-01-02
41.5509
52 wk Low
2026-03-30
37.267
vs
60% BSE100 40% CRISIL Composite Bond Fund Index
Note: returns over 1 year have been annualized
+0.10%
-0.20%
NAV
39.3021
2026-10-09
52 wk High
2026-01-02
41.5509
52 wk Low
2026-03-30
37.267
vs
60% BSE100 40% CRISIL Composite Bond Fund Index
Note: returns over 1 year have been annualized
+0.10%
-0.20%
NAV
39.3021
2026-10-09
52 wk High
2026-01-02
41.5509
52 wk Low
2026-03-30
37.267
vs
60% BSE100 40% CRISIL Composite Bond Fund Index
Note: returns over 1 year have been annualized
+0.10%
-0.20%
NAV
39.3021
2026-10-09
52 wk High
2026-01-02
41.5509
52 wk Low
2026-03-30
37.267
vs
60% BSE100 40% CRISIL Composite Bond Fund Index
Note: returns over 1 year have been annualized
+0.10%
-0.20%
ULIF06914/06/19SecAdvFund101
NAV
15.0753
2026-10-09
52 wk High
2026-08-14
15.2588
52 wk Low
2026-04-02
14.6424
vs
CRISIL Composite Bond Fund Index
Note: returns over 1 year have been annualized
+0.10%
-0.20%
NAV
15.0753
2026-10-09
52 wk High
2026-08-14
15.2588
52 wk Low
2026-04-02
14.6424
vs
CRISIL Composite Bond Fund Index
Note: returns over 1 year have been annualized
+0.10%
-0.20%
NAV
15.0753
2026-10-09
52 wk High
2026-08-14
15.2588
52 wk Low
2026-04-02
14.6424
vs
CRISIL Composite Bond Fund Index
Note: returns over 1 year have been annualized
+0.10%
-0.20%
NAV
15.0753
2026-10-09
52 wk High
2026-08-14
15.2588
52 wk Low
2026-04-02
14.6424
vs
CRISIL Composite Bond Fund Index
Note: returns over 1 year have been annualized
+0.10%
-0.20%
ULIF08028/02/25DynamicFnd101
NAV
10.1436
2026-10-09
52 wk High
2026-01-02
11.2703
52 wk Low
2026-03-30
9.8481
vs
Nifty 50 (80%) And Crisil Composite Bond Index (20%)
Note: returns over 1 year have been annualized
+0.10%
-0.20%
NAV
10.1436
2026-10-09
52 wk High
2026-01-02
11.2703
52 wk Low
2026-03-30
9.8481
vs
Nifty 50 (80%) And Crisil Composite Bond Index (20%)
Note: returns over 1 year have been annualized
+0.10%
-0.20%
NAV
10.1436
2026-10-09
52 wk High
2026-01-02
11.2703
52 wk Low
2026-03-30
9.8481
vs
Nifty 50 (80%) And Crisil Composite Bond Index (20%)
Note: returns over 1 year have been annualized
+0.10%
-0.20%
NAV
10.1436
2026-10-09
52 wk High
2026-01-02
11.2703
52 wk Low
2026-03-30
9.8481
vs
Nifty 50 (80%) And Crisil Composite Bond Index (20%)
Note: returns over 1 year have been annualized
+0.10%
-0.20%
17.09.2020
* Data as of 31st January 2026. Past Performance is not indicative of future performance of the fund.
NAV
29.4937
17.09.2020
52 week High
07.02.2020
52 week Low
23.03.2020
* Data as of 31st January 2026. Past Performance is not indicative of future performance of the fund.
ULIP plans are popular among individuals who prefer both life cover and investment aspects included in a single plan. With so many plans available in India, you should consider the following factors to choose the best ULIP plan that suits your requirements.
Why are you saving/investing? – Wealth creation, child’s education, retirement, tax saving, life cover or buying your dream home. This will help you choose a suitable tenure and type of funds.
You can choose funds basis your risk tolerance:
- Equity fund – High return potential and high risk
- Hybrid fund – Moderate return potential and Moderate risk
- Debt fund – Low return potential and Low risk
Choosing suitable funds is a critical step to invest in ULIPs. ULIPs offer diverse fund choices like equity funds, debt funds and balanced funds. To get a better understanding of the fund’s performance it is recommended to check the funds past 5 and 10 year returns. For example, Discovery Fund (SFIN: ULIP06618/01/18DiscvryFnd101) available with HDFC Life ULIPs has delivered returns of 19.24%** in the past 5 years (as on 30th April 2026)). The fund’s performance also depends on the expertise of the fund manger managing the fund, so you can check for the fund managers experience and background.
ULIPs come with various charges and fees impacting your returns. You should choose ULIPs with minimal charges. The charges are:
Deducted from your premium before it gets invested. With HDFC Life Sampoorn Nivesh Plus you can reduce your premium allocation charges by investing at least Rs.1lakh (regular & limited pay option)
Charged for policy maintenance
This goes towards the management of your funds. It is a certain percentage of your fund value.
Goes towards providing life cover
Charged if your withdraw before the your lock-in period
Charged for switching funds beyond the permissible number of switches.
Charged in case you want to invest additional amount
A claim settlement ratio denotes the number of claims settled out of the ones received in a financial year. A higher claim settlement ratio suggests that the insurer is more likely to honors claims. HDFC Life’s claim settlement ratio is 99.72% for FY 26##.
This denotes the financial health of the insurer and it’s ability to pay long-term obligations. HDFC Life’s solvency ratio is 194% for FY25 which is higher than the mandate^.
Check if the ULIP offers the flexibility of fund switches, partial withdrawals, top-ups and premium redirections.
With ULIPs you can adapt your investments according to the changing market trends by switching your funds. HDFC Life Click 2 Wealth offers free unlimited fund switching.
After the initial lock-in period of 5 years you can partially withdraw from your funds to meet your financial emergencies.
The premium redirection feature allows you to direct your future premiums to different types of funds depending on market conditions and your financial goals.
Top-ups give you the opportunity to make additional contributions to enhance your wealth creation.
Add-on riders can help you enhance financial protection of your policy. You should check if you can opt for rider such as critical illness, accidental death benefit, waiver of premium and others for a comprehensive plan.
Show LessSeveral charges are associated with ULIP that impact the amount invested and reduce the overall returns.
This is collected upfront at the time of policy purchase. If your investment is Rs. 2.00 lakhs and the premium allocation charges are 3% of the investment i.e., Rs. 6000, then only 1.94 lakhs will be invested.
...Read More
Policy administration charges are collected monthly and deducted from the fund value. Assume the charges are Rs. 500 monthly for a 20-year plan. It will amount to Rs. 1,20,000 over 20 years, and your fund value is reduced to that extent.
...Read More
Fund management charges are currently capped at 1.35% per annum of the fund value. A Rs. 2.00 lakh fund will have fund management charges of Rs. 2700/-, which will be deducted annually from your fund value.
...Read More
This fee is for providing life cover and depends on the age of the investor and the sum assured. It is collected monthly from your fund value.
...Read More
Charges are collected when the investor switches from one to another within the same group. The charges are nominal and are deducted from the fund value.
...Read More
Charges are collected for the premature withdrawal of some units.
...Read More
Since the charges collected reduce the overall returns to a large extent, it is recommended to invest in ULIP plans with nominal changes. Even a 1% charge can lead to lakhs of rupees over 20 years.
A ULIP is a financial instrument that provides the dual benefit of comprehensive life coverage and wealth growth. Additionally, a policyholder can avail various ULIP tax benefits. Understanding taxation on ULIP is essential to claim these benefits correctly. A ULIP plan offers the following tax benefits:
You can claim deductions of up to Rs. 1.5 Lakh every year on premiums applicable under Section 80C3 of the Income Tax Act of 2025, subject to the availability of terms and conditions
Maturity benefits existing under the ULIP policy are exempted under Section 10(10D)3 of the Income Tax Act, 2025.
The life coverage amount paid out to the nominee under certain unfortunate incidents is subject to tax exemption under Section 10(10D)3 of the Income Tax Act. This thereby ensures complete payout to families and financial support during times of need.
The few common myths about investing in ULIPs include:
Reality: With the ULIP top-up option, you can invest surplus funds when available. A policyholder can pay the top-up premium during any time of the policy tenure and receive the same tax benefits as regular premium payments.
Reality: Before ULIPs complete the lock-in period of 5 years, you can discontinue the ULIPs and avail the surrender value after completion of lock-in period . Most importantly, you need not deposit any surrender charges for discontinuing before the end of the policy tenure if it’s after the lock-in period.
Reality: If you are a risk lover, you can continue investing in a conservative fund. However, you can also choose between a mix of equity and debt funds, also known as balanced funds. Additionally, you can switch between funds, considering your risk appetite.
Reality: Since ULIPs provide dual benefits of insurance coverage with investment, just like other insurance plans, they also have rider options.
Thus, during any extreme condition, a policyholder can benefit from partial withdrawal and meet their desired cash requirements.
Reality: Many people believe that because ULIPs are linked with equities, the returns create a deep impact on life coverage. But, without affecting the life coverage, ULIPs either pay out the fund value or complete life coverage, whichever is more, upon the sudden demise of the policyholder.
Watch Mr. Prasun Gajri, CIO HDFC Life answer all the questions on ULIP.
ULIPs can be really uncomplicated!
Tune in to this video to know all about ULIPs.
Riders add more bang for your buck.
UIN: 101A038V01
A Linked, Non-Participating Pure Risk Premium, Individual Life rider where you can get additional income benefits over and above your Sum Assured in the event of total permanent disability due to an accident.
UIN: 101A037V01
A Linked, Non-Participating Pure Risk Premium, Individual Life/Health rider where you can get protected with a proportion of Rider Sum Assured in case of accidental death or partial/total disability due to accident or diagnosed with Cancer.
UIN: 101A034V01
A Linked, Non-Participating Savings/Pure Risk Premium, Individual Health rider where you can get lump sum benefit equivalent to Rider Sum Assured on diagnosis of any of the covered 60 Critical Illnesses or benefit as a proportionate of the Rider Sum Assured on diagnosis of Early Stage Cancer / Major Cancer depending on the plan option chosen.
UIN: 101A035V01
A Linked, Non-Participating, Individual Pure Risk Premium, Life/Health rider where you can get Waiver of Premium for the base policy premium and premiums of any other additional riders, in case of death, disability or diagnosis of any listed critical illnesses of the Rider Life Assured. Enjoy continued policy benefits even in case of life's eventualities.
UIN: 101A036V02
A Linked, Non- Participating Individual, Pure Risk Premium/ Savings, Life/ Health Insurance Rider where you can get lump Sum benefit equivalent to Rider Sum Assured on death/terminal illness/accidental death/hospitalisation or benefit as a proportionate of the Rider Sum Assured on disability due to accident/undergoing any listed surgery, depending on the plan option chosen.
The ULIP fund value lets you know how much your investment is worth at any given time. You can calculate the amount the multiplying the number of units owned by the Net Asset Value (NAV) or monetary value of each unit.
The sum assured refers to the life insurance payout. The beneficiary receives the sum assured on the policyholder's unfortunate demise during the policy term.
ULIPs allow partial withdrawals from the collected corpus in certain circumstances after the lock-in period. The policyholder can withdraw a small amount from the fund to deal with certain financial situations.
A fund switch allows you, the investor, to make changes to your investment allocation as part of your plan. The number of ULIP funds allowed per year depends on your policy.
A top-up is an additional amount you can pay, over and above the regular premium, to increase the investment in your ULIP.
Your policy document is a contract between you, the policyholder, and your insurance company. You agree to make premium payments, and the insurance company agrees to invest your money and provide life insurance coverage.
Some ULIPs only require one investment at the start, so they are single-premium contracts.
Most ULIPs require you to make monthly, quarterly, biannual or annual payments towards your plan, making them regular-premium contracts.
You can give up your ULIP plan before maturity in contract surrender.
The surrender value refers to the amount the insurance company owes you on contract surrender.
Maturity benefits refer to the funds payable to you by your insurance company on maturity.
On the policyholder's unfortunate demise, the beneficiary receives the sum assured, which is the death benefit.
The survival benefit refers to the periodic benefits the ULIP plan provides the policyholder while the plan is active.
Every insurance company levies certain costs on their ULIPs, such as administrative charges, mortality charges, fund allocation charges and more.
ULIP stands for Unit-Linked Insurance Plan. This plan combines life insurance with market-associated investments. A portion of your premium provides life cover. The rest of the amount is invested in funds such as equity, debt or hybrid options. Your returns depend on market performance.
ULIP typically offer equity funds for growth, debt funds for stability and hybrid funds that blend both. You can choose based on your risk appetite and financial goals.
Standard charges are premium allocation charges, fund management charges, policy administration charges, switching charges and mortality charges. These are mentioned clearly in your policy document.
ULIP come with a mandatory lock-in of five years, during which withdrawals are not allowed.
Tax Benefits may be available as per the provisions of the Income-tax Act, 2025 (Corresponding Income-tax Act, 1961) as amended from time to time. Tax benefits are subject to changes in tax laws. The customer is requested to seek tax advice from his chartered accountant or personal tax advisor with respect to his personal tax liabilities under Indian Income-tax law.
Partial withdrawals are permitted after completing the lock-in of five years, based on policy rules.
Since investments are market-linked, returns can fluctuate. Selecting suitable funds as well as examining performance on a regular basis assists in managing risk well.
Staying invested for at least 10–15 years helps you ride out market ups and downs and benefit from long-term growth.
You get the accumulated fund value depending on the current NAV. Some plans even permit settlement options where you can take the amount based on instalments.
Fund value can be checked through your insurer’s website, mobile app, NAV updates, and periodic policy statements.
No. ULIP returns are not assured, as they depend on market performance and the fund type chosen.
Examine your fund performance on a regular basis, switch funds when needed, remain invested over the long-term and use premium redirection to benefit from better-performing funds.
Yes, you can surrender your ULIP, but if done within the lock-in period, the fund value is moved to a discontinued fund and paid after five years, subject to charges.
Maturity and death benefits may be tax*-free under Section 10(10D) of the Income Tax Act, 1961, provided your policy meets the required conditions.
ULIPs offer life cover plus investment options. Mutual funds concentrate on investment. However, SIPs are a method of investing in mutual funds via regular contributions.
Use our quick and simple calculator to plan your investments better
We help you to make informed insurance decisions for a lifetime.
Reviewed by Life Insurance Experts
We at HDFC Life are committed to offer innovative products and services that enable individuals live a ‘Life of Pride’. For over two decades we have been providing life insurance plans - protection, pension, savings, investment, annuity and health.
* Tax Laws are subject to change from time to time.Customer is requested to seek tax advice from his Chartered Accountant or personal tax advisor with respect to his personal tax liabilities under the Tax Laws.
**The returns mentioned is the 5-year benchmark return percentage of Discovery Fund data as of 31st July 2026, and is not indicative returns of HDFC Life Discovery Fund (ULIP06618/01/18DiscvryFnd101).
1. Opt for Settlement Option to receive maturity benefit in periodical installments.
2. As per Income Tax Act, 2025. Tax benefits are subject to changes in tax laws.
3. Tax benefits & exemptions are subject to conditions of the Income Tax Act, 2025 and its provisions. Tax Laws are subject to change from time to time. Customer is requested to seek tax advice from his Chartered Accountant or personal tax advisor with respect to his personal tax liabilities under the Income-tax law
8.Guaranteed Maturity Benefit will be paid only on policy maturity provided all due premiums have been paid and will not apply on death or surrender.
13. This is subject to underwriting norms.
18. Save 46,800 on taxes if the insurance premium amount is Rs.1.5 lakh per annum and you are a Regular Individual, Fall under 30% income tax slab having taxable income less than Rs. 50 lakh and Opt for Old tax regime.
0% GST is only for individual life insurance policies effective from Sep 22, 2025
In unit linked policies, the investment risk in the investment portfolio is borne by the policyholder. The linked Insurance products do not offer any liquidity during the first five years of the contract. The policyholders will not be able to surrender/withdraw the monies invested in Unit Linked Insurance Products completely or partially till the end of fifth year.
Unit Linked Life Insurance products are different from the traditional insurance products and are subject to the risk factors. The premium paid in Unit Linked Life Insurance policies are subject to investment risks associated with capital markets and the NAVs of the units may go up or down based on the performance of fund and factors influencing the capital market and the insured is responsible for his/her decisions. The name of the company, name of the brand and name of the contract does not in any way indicate the quality of the contract, its future prospects or returns. Please know the associated risks and the applicable charges, from your insurance agent or the intermediary or policy document of the insurer. The various funds offered under this contract are the names of the funds and do not in any way indicate the quality of these plans, their future prospects and returns.
Life Insurance Coverage is available in this product. Unit Linked Funds are subject to market risks and there is no assurance or guarantee that the objective of the investment fund will be achieved. The premium shall be adjusted on the due date even if it has been received on advance.
##Individual death claim settlement ratio by number of policies as per audited annual statistics for FY 2025-26.

ARN - PP/08/26/37823
Get a Call Back
This service is available between 9 AM - 10 PM IST
Interested in buying insurance plans, then fill the form below to help us call you back. This form is only for exploring insurance plans provided by HDFC Life, for Customer Service queries, please click - Customer Service Queries
Thanks for contacting us.
We will get in touch soon.
Your call is scheduled for , between . You will receive a call from 8291890XXXX. Kindly attend the call. We respect your privacy. We do not spam.
Your call is rescheduled for , between . You will receive a call from 8291890XXXX. Kindly attend the call. We respect your privacy. We do not spam.
Your call is already scheduled for , between . Incase you want to reschedule the call; you can do it using the form above.
We're sorry, but you have reached the maximum number of rescheduling attempts allowed.

Our expert will assist you in buying a right plan for you online.
Reach us between 9 AM - 10 PM IST.
For existing policy related assistance, click here.
A certified expert of HDFC Life will help you.
99.68% Claim Settlement Ratio
For FY 2024-2025
~5 Cr. Number Of Lives Insured
For FY 2024-2025
Disclaimer: By submitting your contact details, you agree to HDFC Life's Privacy Policy and authorize HDFC Life and/or its authorized Service Providers to verify the above information and/or contact you to assist you with the purchase. This will override any HDFC registration made by you. Show Less ...Read More
99.68% Claim Settlement Ratio
For FY 2024-2025
~5 Cr. Number Of Lives Insured
For FY 2024-2025

19.24% 5-year benchmark returns
Get a Call Back
This service is available between 9 AM - 10 PM IST
Interested in buying insurance plans, then fill the form below to help us call you back. This form is only for exploring insurance plans provided by HDFC Life, for Customer Service queries, please click - Customer Service Queries
Thanks for contacting us.
We will get in touch soon.
Your call is scheduled for , between . You will receive a call from 8291890XXXX. Kindly attend the call. We respect your privacy. We do not spam.
Your call is rescheduled for , between . You will receive a call from 8291890XXXX. Kindly attend the call. We respect your privacy. We do not spam.
Your call is already scheduled for , between . Incase you want to reschedule the call; you can do it using the form above.
We're sorry, but you have reached the maximum number of rescheduling attempts allowed.
 :1800-266-9777



 Written By: